Big Lots 2011 Annual Report Download - page 3
Download and view the complete annual report
Please find page 3 of the 2011 Big Lots annual report below. You can navigate through the pages in the report by either clicking on the pages listed below, or by using the keyword search tool below to find specific information within the annual report.-
 1
1 -
 2
2 -
 3
3 -
 4
4 -
 5
5 -
 6
6 -
 7
7 -
 8
8 -
 9
9 -
 10
10 -
 11
11 -
 12
12 -
 13
13 -
 14
14 -
15
-
16
-
17
-
18
-
19
-
20
-
21
-
22
-
23
-
24
-
25
-
26
-
27
-
28
-
29
-
30
-
31
-
32
-
33
-
34
-
35
-
36
-
37
-
38
-
39
-
40
-
41
-
42
-
43
-
44
-
45
-
46
-
47
-
48
-
49
-
50
-
51
-
52
-
53
-
54
-
55
-
56
-
57
-
58
-
59
-
60
-
61
-
62
-
63
-
64
-
65
-
66
-
67
-
68
-
69
-
70
-
71
-
72
-
73
-
74
-
75
-
76
-
77
-
78
-
79
-
80
-
81
-
82
-
83
-
84
-
85
-
86
-
87
-
88
-
89
-
90
-
91
-
92
-
93
-
94
-
95
-
96
-
97
-
98
-
99
-
100
-
101
-
102
-
103
-
104
-
105
-
106
-
107
-
108
-
109
-
110
-
111
-
112
-
113
-
114
-
115
-
116
-
117
-
118
-
119
-
120
-
121
-
122
-
123
-
124
-
125
-
126
-
127
-
128
-
129
-
130
-
131
-
132
-
133
-
134
-
135
-
136
-
137
-
138
-
139
-
140
-
141
-
142
-
143
-
144
-
145
-
146
-
147
-
148
-
149
-
150
-
151
-
152
-
153
-
154
-
155
-
156
-
157
-
158
-
159
-
160
-
161
-
162
-
163
-
164
-
165
-
166
-
167
-
168
-
169
-
170
-
171
-
172
-
173
-
174
-
175
-
176
-
177
-
178
-
179
-
180
-
181
-
182
-
183
-
184
-
185
-
186
-
187
-
188
-
189
-
190
-
191
-
192
-
193
-
194
-
195
-
196
-
197
-
198
-
199
-
200
-
201
-
202
-
203
-
204
-
205
-
206
-
207
 |
 |

(f)
The earnings per share for continuing operations, discontinued operations and net income are separately calculated in accordance with Accounting Standards Codification ("ASC") 260;
therefore, the sum of earnings per share for continuing operations and discontinued operations may differ, due to rounding, from the calculated earnings per share of net income.
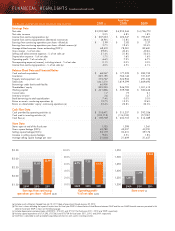
U.S. Segment Sales and Store Data
Comparable store sales growth 0.1% 2.5% 0.7%
Average sales per store $ 3,608 $ 3,556 $ 3,462
Sales per selling square foot $ 166 $ 166 $ 162
Stores open at end of the fiscal year 1,451 1,398 1,361
Canada Segment Sales and Store Data
Average sales per store (a) $ 757 – –
Sales per selling square foot (a) $ 39 – –
Stores open at end of the fiscal year 82 – –
($ in thousands, except per share amounts and sales per selling square foot) 2 011 (a) 2010 2009
Fiscal Year
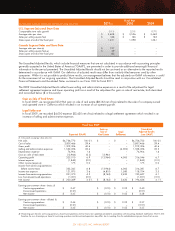
The Unaudited Adjusted Results, which include financial measures that are not calculated in accordance with accounting principles
generally accepted in the United States of America ("GAAP"), are presented in order to provide additional meaningful financial
information for the period presented. The Unaudited Adjusted Results should not be construed as an alternative to the reported results
determined in accordance with GAAP. Our definition of adjusted results may differ from similarly titled measures used by other
companies. While it is not possible to predict future results, our management believes that the adjusted non-GAAP information is useful
for the assessment of our ongoing operations. The Unaudited Adjusted Results should be read in conjunction with our Consolidated
Financial Statements and the related Notes contained in our Form 10-K for fiscal 2011.
The 2009 Unaudited Adjusted Results reflect lower selling and administrative expenses as a result of the adjustment for legal
settlement agreement expense and lower operating profit as a result of the adjustment for gain on sale of real estate, both described
and reconciled below ($ in thousands):
Gain on Sale of Real Estate
In fiscal 2009, we recognized $12,964 gain on sale of real estate ($8,163 net of tax) related to the sale of a company-owned
and operated store in California which resulted in an increase of our operating profit.
Legal Settlement
In fiscal 2009, we recorded $4,000 expense ($2,420 net of tax) related to a legal settlement agreement which resulted in an
increase of selling and administrative expenses.
Fiscal Year 2009
($ in thousands, except per share amounts)
Net sales $ 4,726,772 100.0 % $ – $ – $ 4,726,722 100.0 %
Cost of sales 2,807,466 59.4 – – 2,807,466 59.4
Gross profit 1,919,306 40.6 – – 1,919,306 40.6
Selling and administrative expenses 1,532,356 32.4 – (4,000) 1,528,356 32.3
Depreciation expense 74,904 1.6 – – 74,904 1.6
Gain on sale of real estate (12,964) (0.3) 12,964 – – –
Operating profit 325,010 6.9 (12,964) 4,000 316,046 6.7
Interest expense (1,840) (0.0) – – (1,840) (0.0)
Other income (expense) 175 0.0 – – 175 0.0
Income from continuing operations
before income taxes 323,345 6.8 (12,964) 4,000 314,381 6.7
Income tax expense 121,975 2.6 (4,801) 1,580 118,754 2.5
Income from continuing operations 201,370 4.3 (8,163) 2,420 195,627 4.1
Loss from discontinued operations (1,001) (0.0) – – (1,001) (0.0)
Net income $ 200,369 4.2 % $ (8,163) $ 2,420 $ 194,626 4.1 %
Earnings per common share - basic: (f)
Continuing operations $ 2.47 $ (0.10) $ 0.03 $ 2.40
Discontinued operations (0.01) – – (0.01)
Net income $ 2.45 $ (0.10) $ 0.03 $ 2.38
Earnings per common share - diluted: (f)
Continuing operations $ 2.44 $ (0.10) $ 0.03 $ 2.37
Discontinued operations (0.01) – – (0.01)
Net income $ 2.42 $ (0.10) $ 0.03 $ 2.35
Gain on
Sale of
Real Estate
Reported (GAAP)
Legal
Settlement
Unaudited
Adjusted Results
(non-GAAP)
2011 BIG LOTS, INC. ANNUAL REPORT