Berkshire Hathaway 2013 Annual Report Download - page 88
Download and view the complete annual report
Please find page 88 of the 2013 Berkshire Hathaway annual report below. You can navigate through the pages in the report by either clicking on the pages listed below, or by using the keyword search tool below to find specific information within the annual report.-
 1
1 -
2
-
3
-
4
-
5
-
6
-
7
-
8
-
9
-
10
-
11
-
12
-
13
-
14
-
15
-
16
-
17
-
18
-
19
-
20
-
21
-
22
-
23
-
24
-
25
-
26
-
27
-
28
-
29
-
30
-
31
-
32
-
33
-
34
-
35
-
36
-
37
-
38
-
39
-
40
-
41
-
42
-
43
-
44
-
45
-
46
-
47
-
48
-
49
-
50
-
51
-
52
-
53
-
54
-
55
-
56
-
57
-
58
-
59
-
60
-
61
-
62
-
63
-
64
-
65
-
66
-
67
-
68
-
69
-
70
-
71
-
72
-
73
-
74
-
75
-
76
-
77
-
 78
78 -
 79
79 -
 80
80 -
 81
81 -
 82
82 -
 83
83 -
 84
84 -
 85
85 -
 86
86 -
 87
87 -
 88
88 -
 89
89 -
 90
90 -
 91
91 -
 92
92 -
 93
93 -
 94
94 -
 95
95 -
 96
96 -
 97
97 -
 98
98 -
99
-
100
-
101
-
102
-
103
-
104
-
105
-
106
-
107
-
108
-
109
-
110
-
111
-
112
-
113
-
114
-
115
-
116
-
117
-
118
-
119
-
120
-
121
-
122
-
123
-
124
-
125
-
126
-
127
-
128
-
129
-
130
-
131
-
132
-
133
-
134
-
135
-
136
-
137
-
138
-
139
-
140
 |
 |

Management’s Discussion (Continued)
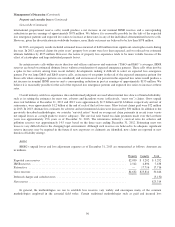
Investment and Derivative Gains/Losses
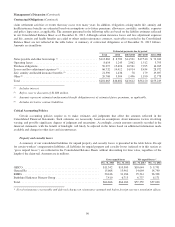
A summary of investment and derivative gains and losses and other-than-temporary impairment losses on investments
follows. Amounts are in millions.
2013 2012 2011
Investment gains/losses:
Sales and other disposals
Insurance and other ........................................................ $2,830 $1,288 $ 1,991
Finance and financial products ............................................... 5 2 162
Other-than-temporary impairment losses ........................................... (228) (337) (908)
Other ....................................................................... 1,458 509 29
4,065 1,462 1,274
Derivative gains/losses:
Equity index put option contracts ................................................. 2,843 997 (1,787)
Credit default contracts ......................................................... (213) 894 (251)
Other derivative contracts ....................................................... (22) 72 (66)
2,608 1,963 (2,104)
Gains/losses before income taxes and noncontrolling interests .............................. 6,673 3,425 (830)
Income taxes and noncontrolling interests ...................................... 2,336 1,198 (309)
Net gains/losses ................................................................... $4,337 $2,227 $ (521)
Investment gains/losses arise primarily from the sale or redemption of investments or when investments are carried at fair
value with the periodic changes in fair values recorded in earnings. The timing of gains or losses from sales or redemptions can
have a material effect on periodic earnings. Investment gains and losses usually have minimal impact on the periodic changes in
our consolidated shareholders’ equity since most of our investments are recorded at fair value with the unrealized gains and
losses included in shareholders’ equity as a component of accumulated other comprehensive income.
We believe the amount of investment gains/losses included in earnings in any given period typically has little analytical or
predictive value. Our decisions to sell securities are not motivated by the impact that the resulting gains or losses will have on
our reported earnings. Although our management does not consider investment gains and losses in a given period as necessarily
meaningful or useful in evaluating periodic earnings, we are providing information to explain the nature of such gains and losses
when they are reflected in earnings.
Pre-tax investment gains/losses in 2013 were $4,065 million. Investment gains in 2013 included approximately $2.1 billion
related to our investments in General Electric and Goldman Sachs common stock warrants and Wrigley subordinated notes.
Beginning in 2013, the unrealized gains or losses associated with the warrants were included in earnings. These warrants were
exercised in October 2013 on a cashless basis in exchange for shares of General Electric and Goldman Sachs common stock
with an aggregate value of approximately $2.4 billion. The Wrigley subordinated notes were repurchased for cash of $5.08
billion, resulting in a pre-tax investment gain of $680 million. Pre-tax investment gains were approximately $1.5 billion in 2012
and were primarily attributable to sales of equity securities. Investment gains in 2011 included aggregate pre-tax gains of $1.8
billion from the redemptions of our Goldman Sachs and General Electric preferred stock investments.
In each of the three years ending December 31, 2013, we recognized OTTI losses on certain of our equity and fixed
maturity investments. OTTI losses on fixed maturity investments were $228 million in 2013, $337 million in 2012 and $402
million in 2011, and substantially all of the losses related to our investments in Texas Competitive Electric Holdings (“TCEH”)
86