Berkshire Hathaway 2013 Annual Report Download - page 66
Download and view the complete annual report
Please find page 66 of the 2013 Berkshire Hathaway annual report below. You can navigate through the pages in the report by either clicking on the pages listed below, or by using the keyword search tool below to find specific information within the annual report.-
 1
1 -
2
-
3
-
4
-
5
-
6
-
7
-
8
-
9
-
10
-
11
-
12
-
13
-
14
-
15
-
16
-
17
-
18
-
19
-
20
-
21
-
22
-
23
-
24
-
25
-
26
-
27
-
28
-
29
-
30
-
31
-
32
-
33
-
34
-
35
-
36
-
37
-
38
-
39
-
40
-
41
-
42
-
43
-
44
-
45
-
46
-
47
-
48
-
49
-
50
-
51
-
52
-
53
-
54
-
55
-
 56
56 -
 57
57 -
 58
58 -
 59
59 -
 60
60 -
 61
61 -
 62
62 -
 63
63 -
 64
64 -
 65
65 -
 66
66 -
 67
67 -
 68
68 -
 69
69 -
 70
70 -
 71
71 -
 72
72 -
 73
73 -
 74
74 -
 75
75 -
 76
76 -
77
-
78
-
79
-
80
-
81
-
82
-
83
-
84
-
85
-
86
-
87
-
88
-
89
-
90
-
91
-
92
-
93
-
94
-
95
-
96
-
97
-
98
-
99
-
100
-
101
-
102
-
103
-
104
-
105
-
106
-
107
-
108
-
109
-
110
-
111
-
112
-
113
-
114
-
115
-
116
-
117
-
118
-
119
-
120
-
121
-
122
-
123
-
124
-
125
-
126
-
127
-
128
-
129
-
130
-
131
-
132
-
133
-
134
-
135
-
136
-
137
-
138
-
139
-
140
 |
 |

Notes to Consolidated Financial Statements (Continued)
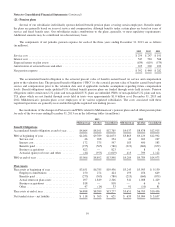
(23) Business segment data (Continued)
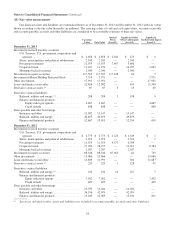
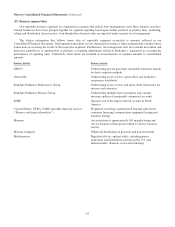
Other businesses not specifically identified with reportable business segments consist of a large, diverse group of
manufacturing, service and retailing businesses. A disaggregation of our consolidated data for each of the three most recent
years is presented in the tables which follow on this and the following two pages (in millions).
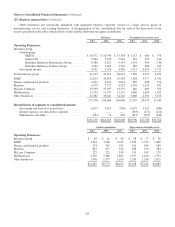
Revenues Earnings before income taxes
2013 2012 2011 2013 2012 2011
Operating Businesses:
Insurance group:
Underwriting:
GEICO ................................... $ 18,572 $ 16,740 $ 15,363 $ 1,127 $ 680 $ 576
General Re ................................ 5,984 5,870 5,816 283 355 144
Berkshire Hathaway Reinsurance Group ........ 8,786 9,672 9,147 1,294 304 (714)
Berkshire Hathaway Primary Group ............ 3,342 2,263 1,749 385 286 242
Investment income ............................. 4,735 4,474 4,746 4,713 4,454 4,725
Total insurance group ............................... 41,419 39,019 36,821 7,802 6,079 4,973
BNSF ............................................ 22,014 20,835 19,548 5,928 5,377 4,741
Finance and financial products ........................ 4,291 4,110 4,014 985 848 774
Marmon .......................................... 6,979 7,171 6,925 1,176 1,137 992
McLane Company .................................. 45,930 37,437 33,279 486 403 370
MidAmerican ..................................... 12,743 11,747 11,291 1,806 1,644 1,659
Other businesses ................................... 42,382 38,647 32,202 5,080 4,591 3,675
175,758 158,966 144,080 23,263 20,079 17,184
Reconciliation of segments to consolidated amount:
Investment and derivative gains/losses .............. 6,673 3,425 (830) 6,673 3,425 (830)
Interest expense, not allocated to segments .......... — — — (303) (271) (221)
Eliminations and other .......................... (281) 72 438 (837) (997) (819)
$182,150 $162,463 $143,688 $28,796 $22,236 $15,314
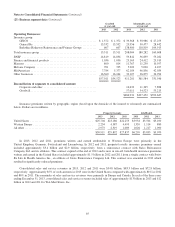
Capital expenditures Depreciation of tangible assets
2013 2012 2011 2013 2012 2011
Operating Businesses:
Insurance group .................................... $ 89 $ 61 $ 40 $ 58 $ 57 $ 56
BNSF ............................................ 3,918 3,548 3,325 1,655 1,573 1,480
Finance and financial products ........................ 251 367 331 182 184 180
Marmon .......................................... 847 817 514 498 479 484
McLane Company .................................. 225 225 188 159 149 129
MidAmerican ..................................... 4,307 3,380 2,684 1,577 1,440 1,333
Other businesses ................................... 1,450 1,377 1,109 1,289 1,264 1,021
$11,087 $9,775 $8,191 $5,418 $5,146 $4,683
64