Berkshire Hathaway 2013 Annual Report Download - page 47
Download and view the complete annual report
Please find page 47 of the 2013 Berkshire Hathaway annual report below. You can navigate through the pages in the report by either clicking on the pages listed below, or by using the keyword search tool below to find specific information within the annual report.-
 1
1 -
2
-
3
-
4
-
5
-
6
-
7
-
8
-
9
-
10
-
11
-
12
-
13
-
14
-
15
-
16
-
17
-
18
-
19
-
20
-
21
-
22
-
23
-
24
-
25
-
26
-
27
-
28
-
29
-
30
-
31
-
32
-
33
-
34
-
35
-
36
-
 37
37 -
 38
38 -
 39
39 -
 40
40 -
 41
41 -
 42
42 -
 43
43 -
 44
44 -
 45
45 -
 46
46 -
 47
47 -
 48
48 -
 49
49 -
 50
50 -
 51
51 -
 52
52 -
 53
53 -
 54
54 -
 55
55 -
 56
56 -
 57
57 -
58
-
59
-
60
-
61
-
62
-
63
-
64
-
65
-
66
-
67
-
68
-
69
-
70
-
71
-
72
-
73
-
74
-
75
-
76
-
77
-
78
-
79
-
80
-
81
-
82
-
83
-
84
-
85
-
86
-
87
-
88
-
89
-
90
-
91
-
92
-
93
-
94
-
95
-
96
-
97
-
98
-
99
-
100
-
101
-
102
-
103
-
104
-
105
-
106
-
107
-
108
-
109
-
110
-
111
-
112
-
113
-
114
-
115
-
116
-
117
-
118
-
119
-
120
-
121
-
122
-
123
-
124
-
125
-
126
-
127
-
128
-
129
-
130
-
131
-
132
-
133
-
134
-
135
-
136
-
137
-
138
-
139
-
140
 |
 |

Notes to Consolidated Financial Statements (Continued)
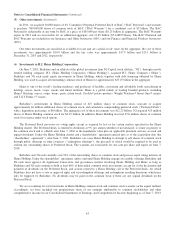
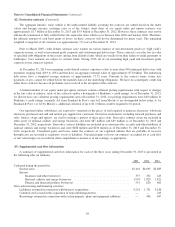
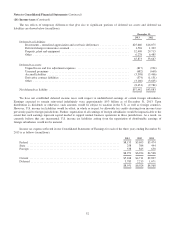
(7) Investment gains/losses (Continued)
in the cost basis of the investment, but not the fair value. Accordingly, such losses that are included in earnings are generally
offset by a corresponding credit to other comprehensive income and therefore have no net effect on shareholders’ equity as of
the balance sheet date.
We recorded OTTI losses on bonds issued by Texas Competitive Electric Holdings (“TCEH”) of $228 million in 2013,
$337 million in 2012 and $390 million in 2011. In 2011, OTTI losses also included $337 million with respect to 103.6 million
shares of our investment in Wells Fargo & Company (“Wells Fargo”) common stock. These shares had an aggregate original
cost of $3.6 billion. On March 31, 2011, when we recorded the losses, we also held an additional 255.4 million shares of Wells
Fargo which were acquired at an aggregate cost of $4.4 billion and which had unrealized gains of $3.7 billion. However, the
unrealized gains were not reflected in earnings but were instead recorded directly in shareholders’ equity as a component of
accumulated other comprehensive income.
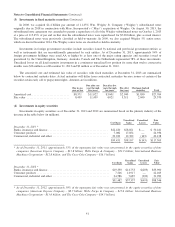
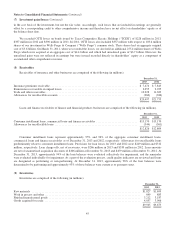
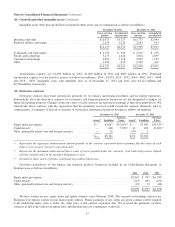
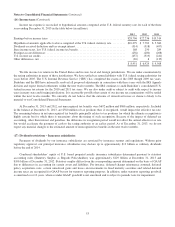
(8) Receivables
Receivables of insurance and other businesses are comprised of the following (in millions).
December 31,
2013 2012
Insurance premiums receivable ............................................................. $ 7,474 $ 7,845
Reinsurance recoverable on unpaid losses .................................................... 3,055 2,925
Trade and other receivables ................................................................ 10,328 11,369
Allowances for uncollectible accounts ....................................................... (360) (386)
$20,497 $21,753
Loans and finance receivables of finance and financial products businesses are comprised of the following (in millions).
December 31,
2013 2012
Consumer installment loans, commercial loans and finance receivables ............................. $13,170 $13,170
Allowances for uncollectible loans .......................................................... (344) (361)
$12,826 $12,809
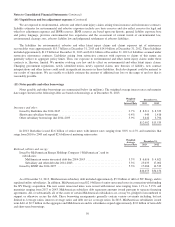
Consumer installment loans represent approximately 95% and 96% of the aggregate consumer installment loans,
commercial loans and finance receivables as of December 31, 2013 and 2012, respectively. Allowances for uncollectible loans
predominantly relate to consumer installment loans. Provisions for loan losses for 2013 and 2012 were $249 million and $312
million, respectively. Loan charge-offs, net of recoveries, were $266 million in 2013 and $339 million in 2012. Loan amounts
are net of unamortized acquisition discounts of $406 million at December 31, 2013 and $459 million at December 31, 2012. At
December 31, 2013, approximately 94% of the loan balances were evaluated collectively for impairment, and the remainder
were evaluated individually for impairment. As a part of the evaluation process, credit quality indicators are reviewed and loans
are designated as performing or non-performing. At December 31, 2013, approximately 98% of the loan balances were
determined to be performing and approximately 93% of those balances were current as to payment status.
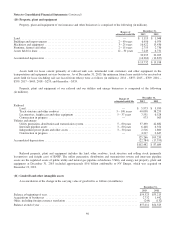
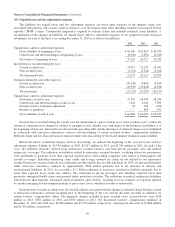
(9) Inventories
Inventories are comprised of the following (in millions).
December 31,
2013 2012
Raw materials ............................................................................ $1,827 $1,699
Work in process and other ................................................................... 849 883
Finished manufactured goods ................................................................ 3,212 3,187
Goods acquired for resale ................................................................... 4,057 3,906
$9,945 $9,675
45