Barnes and Noble 2013 Annual Report Download - page 8
Download and view the complete annual report
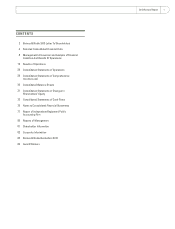
Please find page 8 of the 2013 Barnes and Noble annual report below. You can navigate through the pages in the report by either clicking on the pages listed below, or by using the keyword search tool below to find specific information within the annual report.-
 1
1 -
 2
2 -
 3
3 -
 4
4 -
 5
5 -
 6
6 -
 7
7 -
 8
8 -
 9
9 -
 10
10 -
 11
11 -
 12
12 -
 13
13 -
 14
14 -
 15
15 -
 16
16 -
 17
17 -
 18
18 -
 19
19 -
20
-
21
-
22
-
23
-
24
-
25
-
26
-
27
-
28
-
29
-
30
-
31
-
32
-
33
-
34
-
35
-
36
-
37
-
38
-
39
-
40
-
41
-
42
-
43
-
44
-
45
-
46
-
47
-
48
-
49
-
50
-
51
-
52
-
53
-
54
-
55
-
56
-
57
-
58
-
59
-
60
-
61
-
62
-
63
-
64
-
65
-
66
-
67
-
68
-
69
-
70
-
71
-
72
-
73
-
74
-
75
-
76
-
77
-
78
-
79
-
80
-
81
-
82
-
83
-
84
-
85
-
86
-
87
-
88
 |
 |

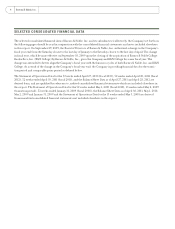
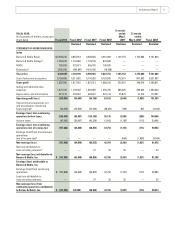
FISCAL YEAR
(In thousands of dollars, except per
share data) Fiscal 2013 Fiscal 2012jFiscal 2011jFiscal 2010j
13 weeks
ended
May 2,
2009j
13 weeks
ended
May 3, 2008jFiscal 2008j
Restated Restated Restated Restated Restated Restated
Basic earnings per common share
Earnings (loss) from continuing
operations attributable to
Barnes & Noble, Inc. $ (3.02) (1.34) (1.22) 0.75 (0.03) (0.00) 1.59
Loss from discontinued operations
attributable to Barnes & Noble, Inc. — — — — (0.01) (0.03) (0.17)
Net earnings (loss) attributable to
Barnes & Noble, Inc. $ (3.02) (1.34) (1.22) 0.75 (0.04) (0.03) 1.42
Diluted earnings per
common share
Earnings (loss) from continuing
operations attributable to
Barnes & Noble, Inc. $ (3.02) (1.34) (1.22) 0.74 (0.03) (0.00) 1.55
Loss from discontinued operations
attributable to Barnes & Noble, Inc. — — — — (0.01) (0.03) (0.17)
Net earnings (loss) attributable to
Barnes & Noble, Inc. $ (3.02) (1.34) (1.22) 0.74 (0.04) (0.03) 1.38
Dividends paid per share $ — — 0.75 1.00 0.25 0.15 0.90
Weighted average common shares
outstanding
Basic 58,247 57,337 56,588 55,344 54,759 57,614 55,207
Diluted 58,247 57,337 56,588 56,153 54,759 57,614 56,529
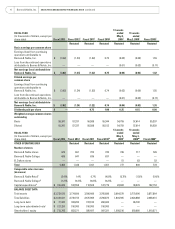
FISCAL YEAR
(In thousands of dollars, except per
share data) Fiscal 2013 Fiscal 2012 Fiscal 2011 Fiscal 2010k
13 weeks
ended
May 2,
2009l
13 weeks
ended
May 3,
2008mFiscal 2008n
OTHER OPERATING DATA Restated Restated Restated Restated Restated Restated
Number of stores
Barnes & Noble stores 675 691 705 720 726 717 726
Barnes & Noble College 686 647 636 637 — — —
B. Dalton stores — — — — 51 83 52
Total 1,361 1,338 1,341 1,357 777 800 778
Comparable sales increase
(decrease)
Barnes & Noble Retailf(3.4)% 1.4% 0.7% (4.8)% (5.7)% (1.5)% (5.4)%
Barnes & Noble Collegeg(1.2)% (0.3)% (0.8)% (0.2)% — — —
Capital expendituresh$ 165,835 163,552 110,502 127,779 22,822 38,278 192,153
BALANCE SHEET DATA
Total assets $ 3,732,536 3,774,699 3,596,466 3,705,686 2,664,279 2,779,006 2,877,864
Total liabilities $ 2,443,631 2,730,155 2,675,969 2,706,875 1,804,905 2,024,688 2,008,031
Long-term debt $ 77,000 324,200 313,100 260,400 — 86,700 —
Long-term subordinated notei$ 127,250 150,000 150,000 150,000 — — —
Shareholders’ equity $ 713,743 852,271 920,497 997,321 1,008,216 959,680 1,010,271
6 Barnes & Noble, Inc. SELECTED CONSOLIDATED FINANCIAL DATA continued