Barnes and Noble 2013 Annual Report Download - page 18
Download and view the complete annual report
Please find page 18 of the 2013 Barnes and Noble annual report below. You can navigate through the pages in the report by either clicking on the pages listed below, or by using the keyword search tool below to find specific information within the annual report.-
 1
1 -
2
-
3
-
4
-
5
-
6
-
7
-
 8
8 -
 9
9 -
 10
10 -
 11
11 -
 12
12 -
 13
13 -
 14
14 -
 15
15 -
 16
16 -
 17
17 -
 18
18 -
 19
19 -
 20
20 -
 21
21 -
 22
22 -
 23
23 -
 24
24 -
 25
25 -
 26
26 -
 27
27 -
 28
28 -
29
-
30
-
31
-
32
-
33
-
34
-
35
-
36
-
37
-
38
-
39
-
40
-
41
-
42
-
43
-
44
-
45
-
46
-
47
-
48
-
49
-
50
-
51
-
52
-
53
-
54
-
55
-
56
-
57
-
58
-
59
-
60
-
61
-
62
-
63
-
64
-
65
-
66
-
67
-
68
-
69
-
70
-
71
-
72
-
73
-
74
-
75
-
76
-
77
-
78
-
79
-
80
-
81
-
82
-
83
-
84
-
85
-
86
-
87
-
88
 |
 |

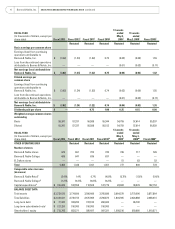
Gross Margin
52 weeks ended
Dollars in thousands
April 27,
2013 % Sales
April 28,
2012 % Sales
B&N Retail $ 1,399,723 30.6% $ 1,454,140 30.0%
B&N College 405,076 23.0% 395,311 22.7%
NOOK (122,293) (24.1)% 68,065 12.8%
Total Gross Margin $ 1,682,506 24.6% $ 1,917,516 26.9%
The Company’s consolidated gross margin decreased
$235.0 million, or 12.3%, to $1.68 billion, in fiscal 2013
from $1.92 billion in fiscal 2012. This decrease was due to
the matters discussed above.
Selling and Administrative Expenses
52 weeks ended
Dollars in thousands
April 27,
2013 % Sales
April 28,
2012 % Sales
B&N Retail $ 1,023,633 22.4% $ 1,130,311 23.3%
B&N College 293,618 16.7% 279,364 16.0%
NOOK 358,125 70.6% 329,777 61.9%
Total Selling and
Administrative
Expenses $ 1,675 ,376 24.5% $ 1,739,452 24.4%
Selling and administrative expenses decreased $64.1
million, or 3.7%, to $1.68 billion in fiscal 2013 from $1.74
billion in fiscal 2012. Selling and administrative expenses
increased as a percentage of sales to 24.5% in fiscal 2013
from 24.4% in fiscal 2012. The increase or (decrease) by
segment is as follows:
•B&N Retail selling and administrative expenses
decreased as a percentage of sales to 22.4% from 23.3%
during the same period one year ago primarily due to
lower net legal and settlement expenses.
•B&N College selling and administrative expenses
increased as a percentage of sales to 16.7% in fiscal 2013
from 16.0% in fiscal 2012. This increase was due to new
stores and increased expenses for digital higher educa-
tion initiatives.
•NOOK selling and administrative expenses increased as a
percentage of sales to 70.6% from 61.9% during the same
period one year ago due primarily to decreased sales, the
impairment of goodwill and increased costs to support
international expansion.
Depreciation and Amortization
52 weeks ended
Dollars in thousands
April 27,
2013 % Sales
April 28,
2012 % Sales
B&N Retail $ 148,855 3.3% $ 162,693 3.4%
B&N College 46,849 2.7% 45,343 2.6%
NOOK 31,430 6.2% 24,631 4.6%
Total Depreciation
and Amortization $ 227,134 3.3% $ 232,667 3.3%
Depreciation and amortization decreased $5.5 million, or
2.4%, to $227.1 million in fiscal 2013 from $232.7 million
in fiscal 2012. This decrease was primarily attributable to
store closings and fully depreciated assets, partially offset
by additional capital expenditures.
Operating Profit (Loss)
52 weeks ended
Dollars in thousands
April 27,
2013 % Sales
April 28,
2012 % Sales
B&N Retail $ 227,235 5.0% $ 161,136 3.3%
B&N College 64,609 3.7% 70,604 4.0%
NOOK (511,848) (100.9)% (286,343) (53.8)%
Total Operating Loss $ (220,004) (3.2)% $ (54,603) (0.8)%
The Company’s consolidated operating loss increased
$165.4 million, or 302.9%, to an operating loss of $220.0
million in fiscal 2013 from an operating loss of $54.6
million in fiscal 2012. This increase was due to the matters
discussed above.
Interest Expense, Net and Amortization of Deferred
Financing Fees
52 weeks ended
Dollars in thousands April 27, 2013 April 28, 2012 % of Change
Interest Expense, Net and
Amortization of Deferred
Financing Fees $ 35,345 $ 35,304 0.1%
Net interest expense and amortization of deferred financing
fees remained flat at $35.3 million in fiscal 2013, as interest
related to the Microsoft Commercial Agreement financing
transaction was offset by lower average borrowings.
Income Taxes
52 weeks ended
Dollars in thousands
April 27,
2013
Effective
Rate
April 28,
2012
Effective
Rate
Income Taxes $ (97,543) 38.2% $ (25,067) 27.9%
16 Barnes & Noble, Inc. MANAGEMENT’S DISCUSSION AND ANALYSIS OF FINANCIAL CONDITION AND RESULTS OF OPERATIONS continued