Barnes and Noble 2010 Annual Report Download - page 7
Download and view the complete annual report
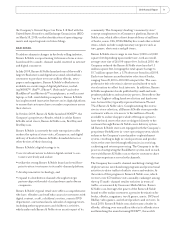
Please find page 7 of the 2010 Barnes and Noble annual report below. You can navigate through the pages in the report by either clicking on the pages listed below, or by using the keyword search tool below to find specific information within the annual report.-
 1
1 -
 2
2 -
 3
3 -
 4
4 -
 5
5 -
 6
6 -
 7
7 -
 8
8 -
 9
9 -
 10
10 -
 11
11 -
 12
12 -
 13
13 -
 14
14 -
 15
15 -
 16
16 -
 17
17 -
 18
18 -
19
-
20
-
21
-
22
-
23
-
24
-
25
-
26
-
27
-
28
-
29
-
30
-
31
-
32
-
33
-
34
-
35
-
36
-
37
-
38
-
39
-
40
-
41
-
42
-
43
-
44
-
45
-
46
-
47
-
48
-
49
-
50
-
51
-
52
-
53
-
54
-
55
-
56
-
57
-
58
-
59
-
60
-
61
-
62
-
63
-
64
-
65
-
66
-
67
-
68
-
69
-
70
-
71
-
72
-
73
-
74
-
75
-
76
 |
 |

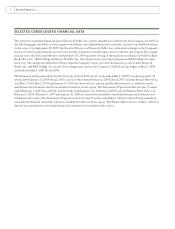
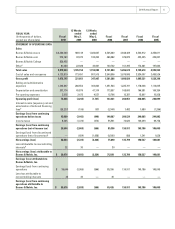
FISCAL YEAR
(In thousands of dollars,
except per share data)
Fiscal
2010
13 Weeks
ended
May 2,
2009
13 Weeks
ended
May 3,
2008
Fiscal
2008
Fiscal
2007
Fiscal
2006
Fiscal
2005
STATEMENT OF OPERATIONS DATA
Sales
Barnes & Noble stores $ 4,320,303 989,149 1,024,667 4,525,020 4,648,409 4,533,912 4,356,611
Barnes & Noble.com 572,763 93,075 100,254 466,082 476,870 433,425 439,657
Barnes & Noble College 836,458 — —————
Othera 81,040 22,928 30,961 130,702 161,395 172,281 197,664
Total sales 5,810,564 1,105,152 1,155,882 5,121,804 5,286,674 5,139,618 4,993,932
Cost of sales and occupancy 4,133,819 773,491 807,915 3,540,596 3,679,845 3,534,097 3,455,536
Gross profit 1,676,745 331,661 347,967 1,581,208 1,606,829 1,605,521 1,538,396
Selling and administrative
expenses 1,392,207 286,554 303,863 1,251,524 1,225,791 1,178,038 1,112,005
Depreciation and amortization 207,774 45,879 41,314 173,557 168,600 166,581 169,354
Pre-opening expenses 3,518 2,472 4,537 12,796 10,387 12,897 10,938
Operating profit (loss) 73,246 (3,244) (1,747) 143,331 202,051 248,005 246,099
Interest income (expense), net and
amortization of deferred financing
feesb (28,237) (199) 807 (2,344) 7,483 1,680 (1,296)
Earnings (loss) from continuing
operations before taxes 45,009 (3,443) (940) 140,987 209,534 249,685 244,803
Income taxes 8,365 (1,374) (374) 55,591 74,623 100,499 99,758
Earnings (loss) from continuing
operations (net of income tax) 36,644 (2,069) (566) 85,396 134,911 149,186 145,045
Earnings (loss) from discontinued
operations (net of income tax)c — (654) (1,658) (9,506) 888 1,341 1,636
Net earnings (loss) 36,644 (2,723) (2,224) 75,890 135,799 150,527 146,681
Loss attributable to noncontrolling
interestsd 32 30 — 30 — — —
Net earnings (loss) attributable to
Barnes & Noble, Inc. $ 36,676 (2,693) (2,224) 75,920 135,799 150,527 146,681
Earnings (loss) attributable to
Barnes & Noble, Inc.
Earnings (loss) from continuing
operations $ 36,644 (2,069) (566) 85,396 134,911 149,186 145,045
Less loss attributable to
noncontrolling interests 32 30 — 30 — — —
Earnings (loss) from continuing
operations attributable to
Barnes & Noble, Inc. $ 36,676 (2,039) (566) 85,426 134,911 149,186 145,045
2010 Annual Report 5