Barnes and Noble 2010 Annual Report Download - page 17
Download and view the complete annual report
Please find page 17 of the 2010 Barnes and Noble annual report below. You can navigate through the pages in the report by either clicking on the pages listed below, or by using the keyword search tool below to find specific information within the annual report.-
 1
1 -
2
-
3
-
4
-
5
-
6
-
 7
7 -
 8
8 -
 9
9 -
 10
10 -
 11
11 -
 12
12 -
 13
13 -
 14
14 -
 15
15 -
 16
16 -
 17
17 -
 18
18 -
 19
19 -
 20
20 -
 21
21 -
 22
22 -
 23
23 -
 24
24 -
 25
25 -
 26
26 -
 27
27 -
28
-
29
-
30
-
31
-
32
-
33
-
34
-
35
-
36
-
37
-
38
-
39
-
40
-
41
-
42
-
43
-
44
-
45
-
46
-
47
-
48
-
49
-
50
-
51
-
52
-
53
-
54
-
55
-
56
-
57
-
58
-
59
-
60
-
61
-
62
-
63
-
64
-
65
-
66
-
67
-
68
-
69
-
70
-
71
-
72
-
73
-
74
-
75
-
76
 |
 |

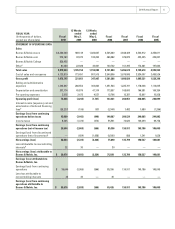
Cost of sales and occupancy increased $593.2 million, or
16.8%, to $4.13 billion in fiscal 2010 from $3.54 billion
in fiscal 2008. Cost of sales and occupancy increased as
a percentage of sales to 71.1% in fiscal 2010 from 69.1%
during fiscal 2008. B&N Retail Segment cost of sales and
occupancy increased as a percentage of sales to 69.9% from
69.1% during the 52 weeks ended May 1, 2010 and January
31, 2009, respectively. This increase was primarily attribut-
able to higher online sales due to the promotional launch
of EDLP, NOOK™ and eBook sales, offset by reductions
in returns to suppliers due to tighter inventory purchas-
ing controls and reductions in the Company’s distribution
center average cost per unit processed, as well as lower
freight costs in general.
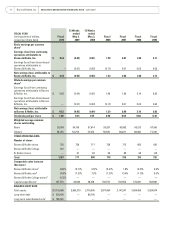
Selling and Administrative Expenses
52 weeks ended
Dollars in thousands
May 1,
2010 % Sales
January
31, 2009 % Sales
B&N Retail Segment $ 1,240,039 24.9% $ 1,251,524 24.4%
B&N College Segment 152,168 18.2% — 0.0%
Total Selling and
Administrative Expenses $ 1,392,207 24.0% $ 1,251,524 24.4%
Selling and administrative expenses increased $140.7
million, or 11.2%, to $1.39 billion in fiscal 2010 from $1.25
billion in fiscal 2008. Selling and administrative expenses
decreased as a percentage of sales to 24.0% in fiscal 2010
from 24.4% during fiscal 2008. B&N Retail Segment selling
and administrative expenses increased as a percentage of
sales to 24.9% during the 52 weeks ended May 1, 2010 from
24.4% during the 52 weeks ended January 31, 2009. This
increase was primarily due to $10.4 million of Acquisition-
related costs, increased resources into the Company’s
digital strategies and the deleveraging of fixed expenses
with the negative comparable store sales, offset by a $6.7
million benefit related to an insurance settlement.
Depreciation and Amortization
52 weeks ended
Dollars in thousands
May 1,
2010 % Sales
January
31, 2009 % Sales
B&N Retail Segment $ 182,911 3.7% $ 173,557 3.4%
B&N College Segment 24,863 3.0% — 0.0%
Total Depreciation and
Amortization $ 207,774 3.6% $ 173,557 3.4%
Depreciation and amortization increased $34.2 million,
or 19.7%, to $207.8 million in fiscal 2010, from $173.6
million in fiscal 2008. During the 52 weeks ended May 1,
2010, B&N Retail Segment depreciation and amortization
increased $9.4 million, or 5.4%, to $182.9 million from
$173.6 million during the 52 weeks ended January 31,
2009. This increase was primarily due to the shift in capital
expenditures from new store openings to existing store
maintenance and technology investments that have shorter
economic lives.
Pre-opening Expenses
52 weeks ended
Dollars in thousands
May 1,
2010 % Sales
January
31, 2009 % Sales
B&N Retail Segment $ 3,461 0.1% $ 12,796 0.2%
B&N College Segment 57 0.0% — 0.0%
Total Pre-opening Expenses $ 3,518 0.1% $ 12,796 0.2%
Pre-opening expenses decreased $9.3 million, or 72.5%,
in fiscal 2010 to $3.5 million from $12.8 million in fiscal
2008. This decrease was primarily the result of the lower
volume of Barnes & Noble new store openings.
Operating Profit
52 weeks ended
Dollars in thousands
May 1,
2010 % Sales
January
31, 2009 % Sales
B&N Retail Segment $ 73,170 1.5% $ 143,331 2.8%
B&N College Segment 76 0.0% — 0.0%
Total Operating Profit $ 73,246 1.3% $ 143,331 2.8%
The Company’s consolidated operating profit decreased
$70.1 million, or 48.9%, to $73.2 million in fiscal 2010
from $143.3 million in fiscal 2008. This decrease in
operating profit was primarily due to the matters discussed
above.
Interest Expense, Net and Amortization of Deferred
Financing Fees
52 weeks ended
Dollars in thousands
May 1,
2010
January 31,
2009
% of
Change
Interest Expense, Net and
Amortization of Deferred
Financing Fees $ 28,237 $ 2,344 1,104.7%
Net interest expense and amortization of deferred financ-
ing fees increased $25.9 million, or 1,104.7%, to $28.2
million in fiscal 2010 from $2.3 million in fiscal 2008. This
increase in interest expense was primarily due to the inter-
est expense related to the notes issued in connection with
the Acquisition of B&N College.
2010 Annual Report 15