Barnes and Noble 2010 Annual Report Download - page 18
Download and view the complete annual report
Please find page 18 of the 2010 Barnes and Noble annual report below. You can navigate through the pages in the report by either clicking on the pages listed below, or by using the keyword search tool below to find specific information within the annual report.-
 1
1 -
2
-
3
-
4
-
5
-
6
-
7
-
 8
8 -
 9
9 -
 10
10 -
 11
11 -
 12
12 -
 13
13 -
 14
14 -
 15
15 -
 16
16 -
 17
17 -
 18
18 -
 19
19 -
 20
20 -
 21
21 -
 22
22 -
 23
23 -
 24
24 -
 25
25 -
 26
26 -
 27
27 -
 28
28 -
29
-
30
-
31
-
32
-
33
-
34
-
35
-
36
-
37
-
38
-
39
-
40
-
41
-
42
-
43
-
44
-
45
-
46
-
47
-
48
-
49
-
50
-
51
-
52
-
53
-
54
-
55
-
56
-
57
-
58
-
59
-
60
-
61
-
62
-
63
-
64
-
65
-
66
-
67
-
68
-
69
-
70
-
71
-
72
-
73
-
74
-
75
-
76
 |
 |

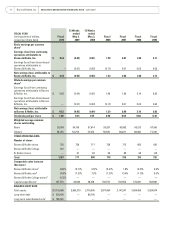
Income Taxes
52 weeks ended
Dollars in thousands
May 1,
2010
Effective
Rate
January 31,
2009
Effective
Rate
Income Taxes $ 8,365 18.6% $ 55,591 39.4%
Income taxes were $8.4 million in fiscal 2010 compared
with $55.6 million in fiscal 2008. The Company’s effective
tax rate in fiscal 2010 decreased to 18.6% compared with
39.4% during fiscal 2008. The decrease in the effective
tax rate was due primarily to the recognition of previ-
ously unrecognized tax benefits for years settled with the
applicable tax authorities. This benefit was partially offset
by additional accruals for subsequent years’ unrecognized
tax benefits.
Loss from Discontinued Operations
On February 25, 2009, the Company sold its interest in
Calendar Club to Calendar Club and its chief executive offi-
cer for $7.0 million, which was comprised of $1.0 million in
cash and $6.0 million in notes. Calendar Club is no longer
a subsidiary of the Company and the results of Calendar
Club have been classified as discontinued operations in all
periods presented. Accordingly, the Company reported a
$9.5 million loss from discontinued operations for the 52
weeks ended January 31, 2009.
Net Loss Attributable to Noncontrolling Interests
Net loss attributable to noncontrolling interests was $0.03
million during fiscal 2010 and fiscal 2008, and relates to
the 50% outside interest in Begin Smart LLC.
Net Earnings Attributable to Barnes & Noble, Inc.
52 weeks ended
Dollars in thousands
May 1,
2010
Diluted
EPS
January 31,
2009
Diluted
EPS
Net Earnings
Attributable to
Barnes & Noble, Inc. $ 36,676 $ 0.63 $ 75,920 $ 1.29
As a result of the factors discussed above, the Company
reported consolidated net earnings of $36.7 million (or
$0.63 per diluted share) during fiscal 2010, compared with
consolidated net earnings of $75.9 million (or $1.29 per
diluted share) during fiscal 2008.
13 WEEKS ENDED MAY 2, 2009 COMPARED WITH
13 WEEKS ENDED MAY 3, 2008
Sales
The following table summarizes the Company’s sales for the
13 weeks ended May 2, 2009 and May 3, 2008:
13 weeks ended
Dollars in thousands
May 2,
2009 % Total
May 3,
2008 % Total
B&N Retail Segment
B&N Stores $ 989,149 89.5% $ 1,024,667 88.6%
B&N.com 93,075 8.4% 100,254 8.7%
Other 22,928 2.1% 30,961 2.7%
Total Sales $ 1,105,152 100.0% $ 1,155,882 100.0%
During the 13 weeks ended May 2, 2009, the Company’s
sales decreased $50.7 million, or 4.4%, to $1.11 billion
from $1.16 billion during the 13 weeks ended May 3, 2008.
This decrease was primarily attributable to the following:
tBarnes & Noble store sales for the 13 weeks ended May
2, 2009 decreased $35.5 million, or 3.5%, to $989.1
million from $1.02 billion during the 13 weeks ended
May 3, 2008, and accounted for 89.5% of total Company
sales. The 3.5% decrease in Barnes & Noble store sales
was primarily attributable to a 4.9% decrease in transac-
tion volume driven by a decline in traffic stemming from
general economic conditions, which resulted in a 5.7%
decrease in comparable store sales or $54.6 million, and
closed stores that decreased sales by $23.4 million, offset
by new Barnes & Noble store sales of $42.2 million.
The 5.7% decrease in comparable store sales was also
attributable to the decrease in comparable music and
audio department sales caused by industry trends toward
electronic downloads.
tBarnes & Noble.com sales decreased $7.2 million, or
7.2%, to $93.1 million during the 13 weeks ended May
2, 2009 from $100.3 million during the 13 weeks ended
May 3, 2008. This decrease was primarily due to lower
conversion ratio, which measures the ratio of online
orders to visits. The decrease was also due to lower aver-
age online order values.
tOther includes B. Dalton sales. B. Dalton sales decreased
$5.3 million, or 32.7%, to $10.8 million during the 13
weeks ended May 2, 2009 from $16.1 million during the
13 weeks ended May 3, 2008. This decrease was primarily
attributable to the closing of 32 B. Dalton stores over the
prior 12 months.
16 Barnes & Noble, Inc. MANAGEMENT’S DISCUSSION AND ANALYSIS OF FINANCIAL CONDITION AND RESULTS OF OPERATIONS continued