Barnes and Noble 2007 Annual Report Download - page 13
Download and view the complete annual report
Please find page 13 of the 2007 Barnes and Noble annual report below. You can navigate through the pages in the report by either clicking on the pages listed below, or by using the keyword search tool below to find specific information within the annual report.-
 1
1 -
2
-
 3
3 -
 4
4 -
 5
5 -
 6
6 -
 7
7 -
 8
8 -
 9
9 -
 10
10 -
 11
11 -
 12
12 -
 13
13 -
 14
14 -
 15
15 -
 16
16 -
 17
17 -
 18
18 -
 19
19 -
 20
20 -
 21
21 -
 22
22 -
 23
23 -
24
-
25
-
26
-
27
-
28
-
29
-
30
-
31
-
32
-
33
-
34
-
35
-
36
-
37
-
38
-
39
-
40
-
41
-
42
-
43
-
44
-
45
-
46
-
47
-
48
-
49
-
50
-
51
-
52
 |
 |

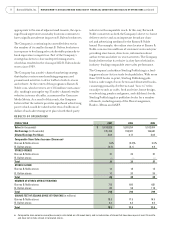
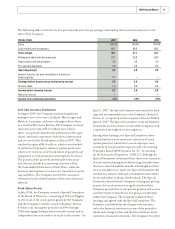
Barnes & Noble store sales increased $114.5 million, or
2.5%, during fi
scal 2007 to $4.648 billion from $4.534
billion during fi
scal 2006 and accounted for 85.9% of
total Company sales. The 2.5% increase in Barnes &
Noble store sales was primarily attributable to new
Barnes & Noble store sales of $159.9 million, coupled
with a 1.8% increase in comparable store sales which
increased sales by $76.1 million, off
set by closed stores
that decreased sales by $70.4 million and the inclusion
of the 53rd week in fi
scal 2006 which accounted for
$77.7 million of sales.
Barnes & Noble.com sales increased $43.4 million, or
10.0%, during fi
scal 2007 to $476.9 million from $433.4
million during fi scal 2006. This increase was attribut-
able to a 13.4% increase in comparable sales.
In fi scal 2007, the Company opened 31 Barnes & Noble
stores and closed 13, bringing its total number of Barnes
& Noble stores to 713 with 18.2 million square feet. The
Company closed 13 B. Dalton stores, ending the period
with 85 B. Dalton stores and 0.3 million square feet. As
of February 2, 2008, the Company operated 798 stores in
the fi
fty states and the District of Columbia.
Cost of Sales and Occupancy
The Company’s cost of sales and occupancy includes
costs such as merchandise costs, distribution center
costs (including payroll, freight, supplies, depreciation
and other operating expenses), rental expense, common
area maintenance, merchant association dues and lease-
required advertising, partially off
set by landlord tenant
allowances amortized over the life of the lease.
Cost of sales and occupancy increased $147.0 million, or
4.1%, to $3.770 billion in fi
scal 2007 from $3.623 billion
in fi
scal 2006. As a percentage of sales, cost of sales and
occupancy increased to 69.7% in fi
scal 2007 from 68.9%
in fi
scal 2006. This increase was primarily attributable
to the impact of the new discount structure in the
Company’s Member program, which went into eff ect in
October 2006, and the deep discount on J.K. Rowling’s
Harry Potter and the Deathly Hallows, off set by a favorable
variance of $10.3 million related to the annual physical
count of inventory.
Selling and Administrative Expenses
Selling and administrative expenses increased $48.4
million, or 4.0%, to $1.250 billion in fi
scal 2007 from
$1.202 billion in fi
scal 2006. As a percentage of sales,
selling and administrative expenses increased to 23.1%
in fi
scal 2007 from 22.8% in fi
scal 2006. This increase
was primarily due to legal costs off
set by a gain in insur-
ance proceeds from the Hurricane Katrina settlement.
Depreciation and Amortization
Depreciation and amortization increased $1.9 million,
or 1.1%, to $172.2 million in fi
scal 2007 from $170.3
million in fi
scal 2006. The increase was primarily due
to the accelerated depreciation related to the closing of
the Company’s Internet distribution center and higher
depreciation in the Company’s new distribution center,
off set by lower depreciation in the Company’s home
offi ce due to certain assets that became fully depreciated.
Pre-Opening Expenses
Pre-opening expenses decreased $2.5 million, or 19.5%,
in fi
scal 2007 to $10.4 million from $12.9 million in
fi scal 2006. The decrease in pre-opening expenses was
primarily the result of the timing of new store openings.
Operating Profi t
The Company’s consolidated operating profi t decreased
$45.2 million, or 17.9%, to $208.1 million in fi
scal 2007
from $253.4 million in fi
scal 2006. This decrease was
primarily due to the matters discussed above.
Interest Income (Expense), Net and Amortization of
Deferred Financing Fees
Interest income (expense), net and amortization of
deferred fi
nancing fees, increased $5.6 million, or
364.2%, to $7.1 million in fi
scal 2007 from $1.5 million
in fi
scal 2006. The increase was primarily due to higher
average cash investments and lower average borrowings.
Income Taxes
Barnes & Noble’s eff ective tax rate in fi scal 2007
decreased to 35.73% compared with 40.25% during
fi scal 2006. The provision for income taxes for fi
scal
2007 included a tax benefi
t of $10.3 million resulting
from previously unrecognized tax benefi
ts for which the
statute of limitations expired in fi
scal 2007.
Minority Interest
Minority interest was $2.6 million in fi scal 2007 com-
pared with $1.8 million in fi
scal 2006, and relates to the
approximate 26% outside interest in Calendar Club.
2007 Annual Report 11