Barclays 2011 Annual Report Download - page 4
Download and view the complete annual report
Please find page 4 of the 2011 Barclays annual report below. You can navigate through the pages in the report by either clicking on the pages listed below, or by using the keyword search tool below to find specific information within the annual report.-
 1
1 -
 2
2 -
 3
3 -
 4
4 -
 5
5 -
 6
6 -
 7
7 -
 8
8 -
 9
9 -
 10
10 -
 11
11 -
 12
12 -
 13
13 -
 14
14 -
 15
15 -
16
-
17
-
18
-
19
-
20
-
21
-
22
-
23
-
24
-
25
-
26
-
27
-
28
-
29
-
30
-
31
-
32
-
33
-
34
-
35
-
36
-
37
-
38
-
39
-
40
-
41
-
42
-
43
-
44
-
45
-
46
-
47
-
48
-
49
-
50
-
51
-
52
-
53
-
54
-
55
-
56
-
57
-
58
-
59
-
60
-
61
-
62
-
63
-
64
-
65
-
66
-
67
-
68
-
69
-
70
-
71
-
72
-
73
-
74
-
75
-
76
-
77
-
78
-
79
-
80
-
81
-
82
-
83
-
84
-
85
-
86
-
87
-
88
-
89
-
90
-
91
-
92
-
93
-
94
-
95
-
96
-
97
-
98
-
99
-
100
-
101
-
102
-
103
-
104
-
105
-
106
-
107
-
108
-
109
-
110
-
111
-
112
-
113
-
114
-
115
-
116
-
117
-
118
-
119
-
120
-
121
-
122
-
123
-
124
-
125
-
126
-
127
-
128
-
129
-
130
-
131
-
132
-
133
-
134
-
135
-
136
-
137
-
138
-
139
-
140
-
141
-
142
-
143
-
144
-
145
-
146
-
147
-
148
-
149
-
150
-
151
-
152
-
153
-
154
-
155
-
156
-
157
-
158
-
159
-
160
-
161
-
162
-
163
-
164
-
165
-
166
-
167
-
168
-
169
-
170
-
171
-
172
-
173
-
174
-
175
-
176
-
177
-
178
-
179
-
180
-
181
-
182
-
183
-
184
-
185
-
186
-
187
-
188
-
189
-
190
-
191
-
192
-
193
-
194
-
195
-
196
-
197
-
198
-
199
-
200
-
201
-
202
-
203
-
204
-
205
-
206
-
207
-
208
-
209
-
210
-
211
-
212
-
213
-
214
-
215
-
216
-
217
-
218
-
219
-
220
-
221
-
222
-
223
-
224
-
225
-
226
-
227
-
228
-
229
-
230
-
231
-
232
-
233
-
234
-
235
-
236
-
237
-
238
-
239
-
240
-
241
-
242
-
243
-
244
-
245
-
246
-
247
-
248
-
249
-
250
-
251
-
252
-
253
-
254
-
255
-
256
-
257
-
258
-
259
-
260
-
261
-
262
-
263
-
264
-
265
-
266
-
267
-
268
-
269
-
270
-
271
-
272
-
273
-
274
-
275
-
276
-
277
-
278
-
279
-
280
-
281
-
282
-
283
-
284
-
285
-
286
 |
 |

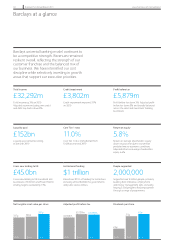
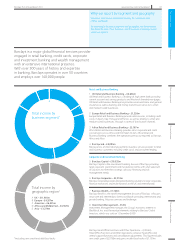
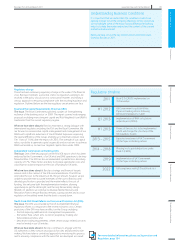
Barclays at a glance
Barclays universal banking model continues to
be a competitive strength. Revenues remained
resilient overall, reflecting the strength of our
customer franchise and the balanced mix of
our business. We have intensified our cost
discipline while selectively investing in growth
areas that support our execution priorities.
Total income Credit impairment Profit before tax
£32,292m £3,802m £5,879m
Total income up 3% on 2010.
Adjusted income excluding own credit
and debt buy-backs down 8%
Credit impairment improved 33%
on 2010
Profit before tax down 3%. Adjusted profit
before tax down 2% and broadly balanced
across the retail and investment banking
businesses
Liquidity pool Core Tier 1 ratio Return on equity
£152bn 11.0% 5.8%
Liquidity pool remained strong,
in line with 2010
Core Tier 1 ratio strengthened from
10.8% at year end 2010
Return on average shareholders’ equity
down on prior year due to worse than
predicted macro economic conditions.
Adjusted return on average shareholders’
equity 6.6%
Gross new lending to UK Institutional funding People supported
£45.0bn $1 trillion 2,000,000
Gross new lending to UK household and
businesses of £45.0bn and Project Merlin
lending targets exceeded by 13%.
Raised over $1trn of funding for institutions,
including almost $400bn for governments
and public sector entities
Supported over 2 million people, primarily
building their enterprise, employment
and money management skills, including
helping 3,500 people to find employment
through a range of programmes
2009 2010 2011
337p 346p
391p
2009 2010 2011
£4,942m
£5,707m £5,590m
2009 2010 2011
2.5p
5.5p 6.0p
Net tangible asset value per share Adjusted profit before tax Dividends per share
02 Barclays PLC Annual Report 2011 www.barclays.com/annualreport