Barclays 2010 Annual Report Download - page 5
Download and view the complete annual report
Please find page 5 of the 2010 Barclays annual report below. You can navigate through the pages in the report by either clicking on the pages listed below, or by using the keyword search tool below to find specific information within the annual report.-
 1
1 -
 2
2 -
 3
3 -
 4
4 -
 5
5 -
 6
6 -
 7
7 -
 8
8 -
 9
9 -
 10
10 -
 11
11 -
 12
12 -
 13
13 -
 14
14 -
 15
15 -
 16
16 -
17
-
18
-
19
-
20
-
21
-
22
-
23
-
24
-
25
-
26
-
27
-
28
-
29
-
30
-
31
-
32
-
33
-
34
-
35
-
36
-
37
-
38
-
39
-
40
-
41
-
42
-
43
-
44
-
45
-
46
-
47
-
48
-
49
-
50
-
51
-
52
-
53
-
54
-
55
-
56
-
57
-
58
-
59
-
60
-
61
-
62
-
63
-
64
-
65
-
66
-
67
-
68
-
69
-
70
-
71
-
72
-
73
-
74
-
75
-
76
-
77
-
78
-
79
-
80
-
81
-
82
-
83
-
84
-
85
-
86
-
87
-
88
-
89
-
90
-
91
-
92
-
93
-
94
-
95
-
96
-
97
-
98
-
99
-
100
-
101
-
102
-
103
-
104
-
105
-
106
-
107
-
108
-
109
-
110
-
111
-
112
-
113
-
114
-
115
-
116
-
117
-
118
-
119
-
120
-
121
-
122
-
123
-
124
-
125
-
126
-
127
-
128
-
129
-
130
-
131
-
132
-
133
-
134
-
135
-
136
-
137
-
138
-
139
-
140
-
141
-
142
-
143
-
144
-
145
-
146
-
147
-
148
-
149
-
150
-
151
-
152
-
153
-
154
-
155
-
156
-
157
-
158
-
159
-
160
-
161
-
162
-
163
-
164
-
165
-
166
-
167
-
168
-
169
-
170
-
171
-
172
-
173
-
174
-
175
-
176
-
177
-
178
-
179
-
180
-
181
-
182
-
183
-
184
-
185
-
186
-
187
-
188
-
189
-
190
-
191
-
192
-
193
-
194
-
195
-
196
-
197
-
198
-
199
-
200
-
201
-
202
-
203
-
204
-
205
-
206
-
207
-
208
-
209
-
210
-
211
-
212
-
213
-
214
-
215
-
216
-
217
-
218
-
219
-
220
-
221
-
222
-
223
-
224
-
225
-
226
-
227
-
228
-
229
-
230
-
231
-
232
-
233
-
234
-
235
-
236
-
237
-
238
-
239
-
240
-
241
-
242
-
243
-
244
-
245
-
246
-
247
-
248
-
249
-
250
-
251
-
252
-
253
-
254
-
255
-
256
-
257
-
258
-
259
-
260
-
261
-
262
-
263
-
264
-
265
-
266
-
267
-
268
-
269
-
270
-
271
-
272
-
273
-
274
-
275
-
276
-
277
-
278
-
279
-
280
-
281
-
282
-
283
-
284
-
285
-
286
-
287
-
288
 |
 |

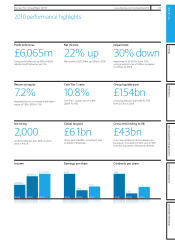
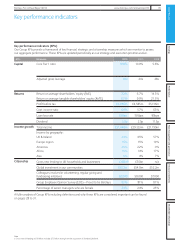
2010 performance highlights
Profit before tax
£6,065m
Group profit before tax up 32% on 2009,
adjusted profit before tax up 11%
Net income
22% up
Net income of £25,768m, up 22% on 2009
Impairment
30% down
Impairment of £5,672m, down 30%,
giving a loan loss rate of 118bps compared
to 156bps for 2009
Return on equity
7.2%
Improved returns on average shareholders’
equity of 7.2% (2009: 6.7%)
Core Tier 1 ratio
10.8%
Core Tier 1 capital ratio of 10.8%
(2009: 10.0%)
Group liquidity pool
£154bn
Group liquidity pool improved by 21%
from £127bn in 2009
Net hiring
2,000
Created 2,000 new jobs, 80% of which
were in the UK
Global tax paid
£6.1bn
UK tax paid of £2.8bn, including £1.3bn
on behalf of employees
Gross new lending to UK
£43bn
Gross new lending to UK households and
businesses increased to £36bn, plus £7.5bn
from the acquisition of Standard Life Bank
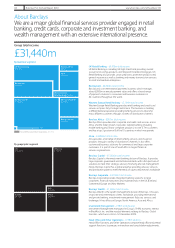
Income
£21,199m
£29,123m
£31,440m
2008 2009 2010
2008 2009 2010
Earnings per share
51.4p
24.1p
30.4p
2008 2009 2010
2008 2009 2010
Dividends per share
11.5p
2.5p
5.5p
2008 2009 2010
2008 2009 2010
Barclays PLC Annual Report 2010 www.barclays.com/annualreport10 03
About Barclays Strategy Performance Risk management and governance Financial statements Shareholder information