BT 2007 Annual Report Download - page 3
Download and view the complete annual report
Please find page 3 of the 2007 BT annual report below. You can navigate through the pages in the report by either clicking on the pages listed below, or by using the keyword search tool below to find specific information within the annual report.-
 1
1 -
 2
2 -
 3
3 -
 4
4 -
 5
5 -
 6
6 -
 7
7 -
 8
8 -
 9
9 -
 10
10 -
 11
11 -
 12
12 -
 13
13 -
 14
14 -
15
-
16
-
17
-
18
-
19
-
20
-
21
-
22
-
23
-
24
-
25
-
26
-
27
-
28
-
29
-
30
-
31
-
32
-
33
-
34
-
35
-
36
-
37
-
38
-
39
-
40
-
41
-
42
-
43
-
44
-
45
-
46
-
47
-
48
-
49
-
50
-
51
-
52
-
53
-
54
-
55
-
56
-
57
-
58
-
59
-
60
-
61
-
62
-
63
-
64
-
65
-
66
-
67
-
68
-
69
-
70
-
71
-
72
-
73
-
74
-
75
-
76
-
77
-
78
-
79
-
80
-
81
-
82
-
83
-
84
-
85
-
86
-
87
-
88
-
89
-
90
-
91
-
92
-
93
-
94
-
95
-
96
-
97
-
98
-
99
-
100
-
101
-
102
-
103
-
104
-
105
-
106
-
107
-
108
-
109
-
110
-
111
-
112
-
113
-
114
-
115
-
116
-
117
-
118
-
119
-
120
-
121
-
122
-
123
-
124
-
125
-
126
-
127
-
128
-
129
-
130
-
131
-
132
-
133
-
134
-
135
-
136
-
137
-
138
-
139
-
140
-
141
-
142
-
143
-
144
-
145
-
146
-
147
-
148
-
149
-
150
-
151
-
152
-
153
-
154
-
155
-
156
-
157
-
158
-
159
-
160
-
161
-
162
-
163
-
164
-
165
-
166
-
167
-
168
-
169
-
170
-
171
-
172
-
173
-
174
-
175
-
176
-
177
-
178
 |
 |

2BT Group plc Annual Report & Form 20-F
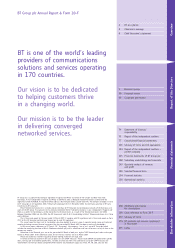
Our principal activities include networked IT services; local, national and
international telecommunications services; higher-value broadband and internet
products and services; and converged fixed/mobile products and services.
.......................................................................................................................................................................................................................................................................................................
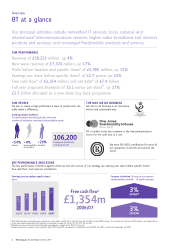
OUR PERFORMANCE
Revenue of £20,223 million, up 4%
New wave revenue of £7,374 million, up 17%
Profit before taxation and specific items
a
of £2,495 million, up 15%
Earnings per share before specific items
a
of 22.7 pence, up 16%
Free cash flow
a
of £1,354 million and net debt
a
of £7.9 billion
Full year proposed dividends of 15.1 pence per share
b
,up27%
£2.5 billion allocated to a new share buy back programme
.......................................................................................................................................................................................................................................................................................................
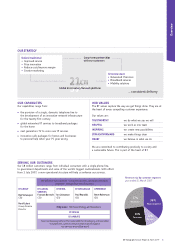
OUR PEOPLE
We aim to create a high-performance team of people who can
really make a difference.
THE WAY WE DO BUSINESS
We aim to do business in an innovative,
ethical and sustainable way.
BT is ranked as the top company in the telecommunications
sector for the sixth year in a row.
We have ISO 9001 certification for most of
our operations in the UK and around the
world.
Overview
BT at a glance
c
c
Earnings per share before specific itemsa
pence
2006/07
3%
2005/06
2006/07 3%
/
19.5
22.7
)
£1,354m
Free cash flowa
aProfit before taxation and specific items, earnings per share before specific items, free cash flow and net debt are non-GAAP measures. The rationale for using non-GAAP measures, and reconciliations
to the most directly comparable IFRS indicators, are provided on pages 30, 34-35, 44, 78, 100, 101 and 102.
bDividends per share represents the dividend paid and proposed in respect of the 2007 financial year.
cAmounts presented in respect of years ended 31 March 2004 and 2003 are presented in accordance with UK GAAP. UK GAAP is not directly comparable with IFRS.
.......................................................................................................................................................................................................................................................................................................
KEY PERFORMANCE INDICATORS
The key performance indicators against which we test the success of our strategy are earnings per share before specific itemsa,
free cash flowaand customer satisfaction.
+54%
Americas
+4%
Europe, the Middle
East and Africa
+29%
Asia Pacific
Building a global workforce
Growth by region (excluding the UK, where the
number of employees remained substantially the same)
106,200
Employees worldwide
including the UK
Dow Jones
Sustainability Indexes
Member 2006/07
.........................................................................................................................
THE QUEEN’S AWARDS
FOR ENTERPRISE:
SUSTAINABLE DEVELOPMEN
T
2003