BT 1999 Annual Report Download - page 4
Download and view the complete annual report
Please find page 4 of the 1999 BT annual report below. You can navigate through the pages in the report by either clicking on the pages listed below, or by using the keyword search tool below to find specific information within the annual report.-
 1
1 -
 2
2 -
 3
3 -
 4
4 -
 5
5 -
 6
6 -
 7
7 -
 8
8 -
 9
9 -
 10
10 -
 11
11 -
 12
12 -
 13
13 -
 14
14 -
 15
15 -
16
-
17
-
18
-
19
-
20
-
21
-
22
-
23
-
24
-
25
-
26
-
27
-
28
-
29
-
30
-
31
-
32
-
33
-
34
-
35
-
36
-
37
-
38
-
39
-
40
-
41
-
42
-
43
-
44
-
45
-
46
-
47
-
48
-
49
-
50
-
51
-
52
-
53
-
54
-
55
-
56
-
57
-
58
-
59
-
60
-
61
-
62
-
63
-
64
-
65
-
66
-
67
-
68
-
69
-
70
-
71
-
72
-
73
-
74
-
75
-
76
-
77
-
78
-
79
-
80
-
81
-
82
-
83
-
84
-
85
-
86
-
87
-
88
-
89
-
90
-
91
-
92
-
93
-
94
-
95
-
96
-
97
-
98
-
99
-
100
-
101
-
102
-
103
-
104
-
105
-
106
-
107
-
108
-
109
-
110
-
111
-
112
-
113
-
114
-
115
-
116
-
117
-
118
-
119
-
120
-
121
-
122
 |
 |

3
•Global venture with AT&T announced
• £1.3 billion invested in strategic alliances and
joint ventures in Europe and Asia Pacific
• 12 per cent growth in demand for BT’s
products and services, driven by rapidly-
expanding Internet traffic and mobile usage
• BT Cellnet’s customer connections up by
1.4 million to 4.5 million
• 7.4 per cent increase in dividends per share
• Net gain of £1,133 million on sale of MCI
shares
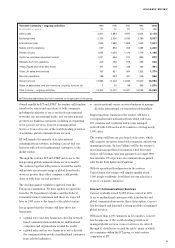
YEARS ENDED 31 MARCH 1999 1998 1997
!!!11110!!!11110!!!11110%
Total turnover
– ongoing activities £18,223m £16,039m £15,021m
Exceptional operating
income (costs) £(69)m £238m –
Total operating profit £3,474m £3,461m £3,429m
Profit on sale of
fixed asset investments £1,107m – –
Profit before taxation £4,295m £3,214m £3,203m
Windfall tax charge – £510m –
Profit after taxation £3,002m £1,727m £2,101m
00001!!!11110!!!11110!!!11110
Basic earnings per share 46.3p 26.6p 32.8p
Basic earnings per share before
exceptional items 34.7p 31.7p 32.8p
Dividends per share – ordinary 20.4p 19.0p 19.85p
– special – – 35.00p
00001!!!11110!!!11110!!!11110
Net cash flow from
operating activities £6,035m £6,071m £6,185m
Capital expenditure £3,269m £3,030m £2,719m
Investment in associates
and joint ventures £1,326m £1,380m £148m
00001!!!11110!!!11110!!!11110
Financial highlights
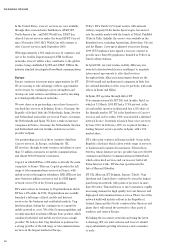
27.8
17.7
31.6
18.7
32.8
54.85
26.6
19.0
46.3
20.4
Earnings and dividends
per share (pence)
YEARS ENDED 31 MARCH
Earnings per share
Dividends per share
95 96 97 98 99
The 1997 dividends included a special
dividend of 35 pence per share.
2,666
1,740
3,019
1,992
3,203
2,101
3,214
1,727
4,295
3,002
Profit before and after tax (£m)
YEARS ENDED 31 MARCH
Profit before tax
Profit after tax
95 96 97 98 99
2,671
2,771
2,719
3,030
3,269
Capital expenditure (£m)
YEARS ENDED 31 MARCH
95 96 97 98 99