BT 1999 Annual Report Download - page 13
Download and view the complete annual report
Please find page 13 of the 1999 BT annual report below. You can navigate through the pages in the report by either clicking on the pages listed below, or by using the keyword search tool below to find specific information within the annual report.-
 1
1 -
2
-
 3
3 -
 4
4 -
 5
5 -
 6
6 -
 7
7 -
 8
8 -
 9
9 -
 10
10 -
 11
11 -
 12
12 -
 13
13 -
 14
14 -
 15
15 -
 16
16 -
 17
17 -
 18
18 -
 19
19 -
 20
20 -
 21
21 -
 22
22 -
 23
23 -
24
-
25
-
26
-
27
-
28
-
29
-
30
-
31
-
32
-
33
-
34
-
35
-
36
-
37
-
38
-
39
-
40
-
41
-
42
-
43
-
44
-
45
-
46
-
47
-
48
-
49
-
50
-
51
-
52
-
53
-
54
-
55
-
56
-
57
-
58
-
59
-
60
-
61
-
62
-
63
-
64
-
65
-
66
-
67
-
68
-
69
-
70
-
71
-
72
-
73
-
74
-
75
-
76
-
77
-
78
-
79
-
80
-
81
-
82
-
83
-
84
-
85
-
86
-
87
-
88
-
89
-
90
-
91
-
92
-
93
-
94
-
95
-
96
-
97
-
98
-
99
-
100
-
101
-
102
-
103
-
104
-
105
-
106
-
107
-
108
-
109
-
110
-
111
-
112
-
113
-
114
-
115
-
116
-
117
-
118
-
119
-
120
-
121
-
122
 |
 |

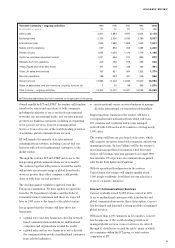
12
UK local and national calls are made each day. These
comprise voice and non-voice calls, such as facsimile
and data transmission, including calls to the Internet.
UK inland local and national calls accounted for
approximately 31% of the group’s turnover in the 1999
financial year.
Call growth in recent years has been stimulated largely
by price reductions and by growth in the UK economy.
The estimated growth rates in call volumes increased more
this year than in each of the last five financial years,
largely because of the expanding use of the Internet
(around 18% of our UK local call minutes in March 1999
was Internet-related traffic) and a significant increase in
calls to mobile phones.
The price structure for call charges varies with distance,
duration, time of day, usage and the applicability of
discount schemes. BT charges for the exact duration
of the call, subject to a minimum charge.
Exchange lines
In the 1999 financial year, UK exchange line rental and
connection charges accounted for approximately 20% of
the group’s turnover. Our exchange line customers are
generally charged a uniform quarterly rental per line. The
charge for business lines is higher than for residential
lines. The increase in exchange line turnover reflects
mainly the growth in business lines in general and high-
speed digital Integrated Services Digital Network (ISDN)
lines in particular. Residential lines declined slightly,
mitigated by the large number of customers installing
second lines.
However, since the beginning of 1995, BT has
experienced a small net reduction in residential line
BUSINESS REVIEW
connections as a result of the continuing competition from
cable operators which offer integrated television and
telephony services. Business connections have shown a
steady increase over the same period.
International calls
International calls accounted for approximately 9% of the
group’s turnover in the 1999 financial year.
International call revenues are derived from outgoing calls
made by customers in the UK and from receipts from non-
UK telecommunications operators for incoming and
transit calls that use BT’s facilities. In turn, BT makes
payments to non-UK operators for the use of their
facilities, primarily for terminating calls.
The UK remains one of the world’s principal
telecommunication transit centres, enabling calls
originating and terminating outside the UK to be routed
through it. International direct dialling from BT’s UK
network is available to virtually all countries and almost
all international calls originating from BT’s UK network
are direct dialled. In the 1999 financial year, the greater
part of BT’s international call traffic was generated from a
limited number of routes and 75% of outgoing call volume
was to 15 countries.
BT continues to seek reductions in interconnection rates,
the charges that telecommunications providers in other
countries make for carrying international calls originating
in the UK. Historically, these have not kept pace with
reductions in the underlying costs of providing
international service except on the more liberalised
routes. We welcome the decision of the European
5.4
0.7
5.2
Exchange line connections
% growth (fall) over previous year
YEARS ENDED 31 MARCH
95
96
97
98
99
Business exchange line connections
Residential exchange line connections
5.3
5.0
6.1
(0.5)
(0.5)
(1.3)
(0.3)
7
6
7
7
9
% annual inland call
volume growth
YEARS ENDED 31 MARCH
95 96 97 98 99