Avon 2006 Annual Report Download - page 62
Download and view the complete annual report
Please find page 62 of the 2006 Avon annual report below. You can navigate through the pages in the report by either clicking on the pages listed below, or by using the keyword search tool below to find specific information within the annual report.-
 1
1 -
2
-
3
-
4
-
5
-
6
-
7
-
8
-
9
-
10
-
11
-
12
-
13
-
14
-
15
-
16
-
17
-
18
-
19
-
20
-
21
-
22
-
23
-
24
-
25
-
26
-
27
-
28
-
29
-
30
-
31
-
32
-
33
-
34
-
35
-
36
-
37
-
38
-
39
-
40
-
41
-
42
-
43
-
44
-
45
-
46
-
47
-
48
-
49
-
50
-
51
-
 52
52 -
 53
53 -
 54
54 -
 55
55 -
 56
56 -
 57
57 -
 58
58 -
 59
59 -
 60
60 -
 61
61 -
 62
62 -
 63
63 -
 64
64 -
 65
65 -
 66
66 -
 67
67 -
 68
68 -
 69
69 -
 70
70 -
 71
71 -
 72
72 -
73
-
74
-
75
-
76
-
77
-
78
-
79
-
80
-
81
-
82
-
83
-
84
-
85
-
86
-
87
-
88
-
89
-
90
-
91
-
92
 |
 |

NOTES TO CONSOLIDATED FINANCIAL STATEMENTS
The credit facility contains various covenants, including a finan-
cial covenant which requires Avon’s interest coverage ratio
(determined in relation to our consolidated pretax income and
interest expense) to equal or exceed 4:1. At December 31, 2006,
there were no amounts outstanding under the credit facility.
We maintain a $1,000.0 commercial paper program. Under the
program, we may issue from time to time unsecured promissory
notes in the commercial paper market in private placements
exempt from registration under federal and state securities laws,
for a cumulative face amount not to exceed $1,000.0 out-
standing at any one time and with maturities not exceeding 270
days from the date of issue. The commercial paper short-term
notes issued under the program are not redeemable prior to
maturity and are not subject to voluntary prepayment. The
commercial paper program is supported by our credit facility.
Outstanding commercial paper effectively reduces the amount
available for borrowing under the credit facility. At
December 31, 2006, we had commercial paper outstanding of
$335.9 at an average annual interest rate of 5.26%.
At December 31, 2006, we were in compliance with all cove-
nants in our indentures. Such indentures do not contain any
rating downgrade triggers that would accelerate the maturity of
our debt.
At December 31, 2006 and 2005, we also had letters of credit
outstanding totaling $24.8, which primarily guarantee various
insurance activities. In addition, we had outstanding letters of
credit for various trade activities and commercial commitments
executed in the ordinary course of business, such as purchase
orders for normal replenishment of inventory levels.
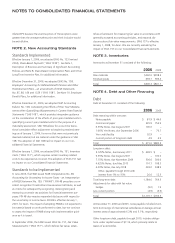
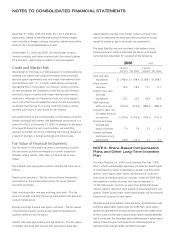
NOTE 5. Accumulated Other
Comprehensive Loss
Accumulated other comprehensive loss at December 31 con-
sisted of the following:
2006 2005
Foreign currency translation adjustments $(256.3) $(359.9)
Unrealized gains from available-for-sale
securities, net of taxes of $.1 and $.1 .3 .2
Minimum pension liability adjustment, net of
taxes of $211.7 – (379.9)
Unrecognized actuarial losses, prior service
credit, and transition obligation, net of
taxes of $202.2 (400.0) –
Net derivative losses from cash flow hedges,
net of taxes of $.2 and $.4 (.3) (1.3)
Total $(656.3) $(740.9)
A fixed-income portfolio included in a grantor trust and mutual
funds that are used to make benefit payments under
non-qualified benefit plans are classified as available-for-sale and
recorded at current market value (see Note 10, Employee Benefit
Plans).
The cost, gross unrealized gains and losses and market value of the
available-for-sale securities at December 31, were as follows:
2006
Cost
Gross
Unrealized
Gains
Gross
Unrealized
Losses
Market
Value
U.S. government bonds (1) $ 2.6 $ – $– $ 2.6
State and municipal bonds (1) 9.9 – – 9.9
Mortgage backed
securities (1) .8 – – .8
Other (1) 3.8 .4 – 4.2
Total available-for-sale
securities (2) $17.1 $.4 $– $17.5
(1) At December 31, 2006, investments with scheduled maturities in less
than two years totaled $3.0, two to five years totaled $1.6, and more
than five years totaled $9.1.
(2) At December 31, 2006, there were no investments with unrealized
losses in a loss position for greater than 12 months.
Payments for the purchases, proceeds and gross realized gains
and losses from the sales of these securities totaled $26.2,
$26.1, $.1 and $(.1), respectively, during 2006.
The cost, gross unrealized gains and losses and market value of
the available-for-sale securities at December 31, were as follows:
2005
Cost
Gross
Unrealized
Gains
Gross
Unrealized
Losses
Market
Value
U.S. government bonds (1) $ 3.4 $ – $ – $ 3.4
State and municipal bonds (1) 9.2 .1 (.1) 9.2
Mortgage backed
securities (1) 1.5 – – 1.5
Other (1) 2.9 .1 – 3.0
Total available-for-sale
securities (2) $17.0 $.2 $(.1) $17.1
(1) At December 31, 2005, investments with scheduled maturities in less
than two years totaled $3.4, two to five years totaled $1.2 and more
than five years totaled $14.7.
(2) At December 31, 2005, there were no investments with unrealized
losses in a loss position for greater than 12 months.
Payments for the purchases, proceeds and gross realized gains
and losses from the sales of these securities totaled $97.9,