Avnet 2008 Annual Report Download - page 6
Download and view the complete annual report
Please find page 6 of the 2008 Avnet annual report below. You can navigate through the pages in the report by either clicking on the pages listed below, or by using the keyword search tool below to find specific information within the annual report.-
 1
1 -
 2
2 -
 3
3 -
 4
4 -
 5
5 -
 6
6 -
 7
7 -
 8
8 -
 9
9 -
 10
10 -
 11
11 -
 12
12 -
 13
13 -
 14
14 -
 15
15 -
 16
16 -
 17
17 -
18
-
19
-
20
-
21
-
22
-
23
-
24
-
25
-
26
-
27
-
28
-
29
-
30
-
31
-
32
-
33
-
34
-
35
-
36
-
37
-
38
-
39
-
40
-
41
-
42
-
43
-
44
-
45
-
46
-
47
-
48
-
49
-
50
-
51
-
52
-
53
-
54
-
55
-
56
-
57
-
58
-
59
-
60
-
61
-
62
-
63
-
64
-
65
-
66
-
67
-
68
-
69
-
70
-
71
-
72
-
73
-
74
-
75
-
76
-
77
-
78
-
79
-
80
-
81
-
82
-
83
-
84
-
85
-
86
-
87
-
88
-
89
-
90
-
91
-
92
-
93
-
94
-
95
-
96
 |
 |

Table of Contents
PART I
Avnet, Inc., incorporated in New York in 1955, together with its consolidated subsidiaries (the “Company” or
“Avnet”), is one of the world’s largest industrial distributors, based on sales, of electronic components, enterprise
computer and storage products and embedded subsystems. With sales of $17.95 billion in fiscal 2008, Avnet creates
a vital link in the technology supply chain that connects more than 300 of the world’s leading electronic component
and computer product manufacturers and software developers with a global customer base of more than 100,000
original equipment manufacturers (“OEMs”), electronic manufacturing services (“EMS”) providers, original design
manufacturers (“ODMs”), and value-added resellers (“VARs”). Avnet distributes electronic components, computer
products and software as received from its suppliers or with assembly or other value added by Avnet. Additionally,
Avnet provides engineering design, materials management and logistics services, system integration and
configuration, and supply chain services.
Organizational Structure
Avnet has two primary operating groups — Electronics Marketing (“EM”) and Technology Solutions (“TS”).
Both operating groups have operations in each of the three major economic regions of the world: the Americas;
Europe, the Middle East and Africa (“EMEA”); and Asia/Pacific, consisting of Asia, Australia and New Zealand
(“Asia” or “Asia/Pac”). Each operating group has its own management team that is led by a group president and
includes regional presidents and senior executives within the operating group that manage the various functions
within the businesses. Each operating group also has distinct financial reporting that is evaluated at the corporate
level on which operating decisions and strategic planning for the Company as a whole are made. Divisions exist
within each operating group that serve primarily as sales and marketing units to further streamline the sales and
marketing efforts within each operating group and enhance each operating group’s ability to work with its customers
and suppliers, generally along more specific product lines or geography. However, each division relies heavily on the
support services provided by each operating group as well as centralized support at the corporate level.
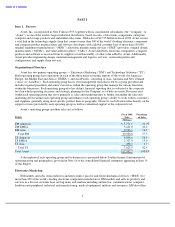
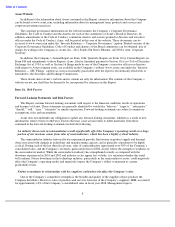
Avnet’s operating groups and their sales are as follows:
A description of each operating group and its businesses is presented below. Further financial information by
operating group and geography is provided in Note 16 to the consolidated financial statements appearing in Item 15
of this Report.
Electronics Marketing
EM markets and sells semiconductors and interconnect, passive and electromechanical devices (“IP&E”) for
more than 300 of the world’s leading electronic component manufacturers. EM markets and sells its products and
services to a diverse customer base serving many end-markets including automotive, communications, computer
hardware and peripheral, industrial and manufacturing, medical equipment, military and aerospace. EM also offers
3
Item 1.
Business
Fiscal 2008
Percentage
Region
Sales
of Sales
(Millions)
EM Americas
$
3,771.9
21.0
%
EM EMEA
3,631.8
20.2
EM Asia
2,923.1
16.3
Total EM
10,326.8
57.5
TS Americas
4,806.6
26.8
TS EMEA
2,327.0
13.0
TS Asia
492.3
2.7
Total TS
7,625.9
42.5
Total Avnet
$
17,952.7
100.0
%