Avnet 2008 Annual Report Download - page 20
Download and view the complete annual report
Please find page 20 of the 2008 Avnet annual report below. You can navigate through the pages in the report by either clicking on the pages listed below, or by using the keyword search tool below to find specific information within the annual report.-
 1
1 -
2
-
3
-
4
-
5
-
6
-
7
-
8
-
9
-
 10
10 -
 11
11 -
 12
12 -
 13
13 -
 14
14 -
 15
15 -
 16
16 -
 17
17 -
 18
18 -
 19
19 -
 20
20 -
 21
21 -
 22
22 -
 23
23 -
 24
24 -
 25
25 -
 26
26 -
 27
27 -
 28
28 -
 29
29 -
 30
30 -
31
-
32
-
33
-
34
-
35
-
36
-
37
-
38
-
39
-
40
-
41
-
42
-
43
-
44
-
45
-
46
-
47
-
48
-
49
-
50
-
51
-
52
-
53
-
54
-
55
-
56
-
57
-
58
-
59
-
60
-
61
-
62
-
63
-
64
-
65
-
66
-
67
-
68
-
69
-
70
-
71
-
72
-
73
-
74
-
75
-
76
-
77
-
78
-
79
-
80
-
81
-
82
-
83
-
84
-
85
-
86
-
87
-
88
-
89
-
90
-
91
-
92
-
93
-
94
-
95
-
96
 |
 |

Table of Contents
For an understanding of Avnet and the significant factors that influenced the Company’
s performance during the
past three fiscal years, the following discussion should be read in conjunction with the description of the business
appearing in Item 1 of this Report and the consolidated financial statements, including the related notes, and other
information appearing in Item 15 of this Report. The Company operates on a “52/53-week” fiscal year. The fiscal
years ended June 28, 2008, June 30, 2007 and July 1, 2006 all contained 52 weeks.
There are numerous references to the impact of foreign currency translation in the discussion of the Company’s
results of operations that follow. Over the past several years, the exchange rates between the US Dollar and many
foreign currencies, especially the Euro, have fluctuated significantly. For example, the US Dollar has weakened
against the Euro by approximately 12% when comparing fiscal 2008 with fiscal 2007 and approximately 7% when
comparing fiscal 2007 with fiscal 2006. When the weaker US Dollar exchange rates of the current year are used to
translate the results of operations of Avnet’s subsidiaries denominated in foreign currencies, the resulting impact is
an increase in US Dollars of reported results as compared with the prior period. In the discussion that follows, this is
referred to as the “translation impact of changes in foreign currency exchange rates.” When this “translation impact
of changes in foreign currency exchange rates” is excluded from the reported results on a pro forma basis, it is
referred to as “constant dollars.” Results as reported in the financial statements which include this translation impact
are referred to as “delivered dollars” or “reported dollars.”
In addition to disclosing financial results that are determined in accordance with US generally accepted
accounting principles (“GAAP”), the Company also discloses certain non-GAAP financial information such as
income or expense items as adjusted for the translation impact of changes in foreign currency exchange rates, as
discussed above, or adjusted for the impact of acquisitions (by adjusting Avnet’s prior periods to include the sales of
businesses acquired as if the acquisitions had occurred at the beginning of the period presented) and divestitures (by
adjusting Avnet’s prior periods to exclude the sales of businesses divested as if the divestitures had occurred at the
beginning of the period presented). In the discussion that follows, the term “pro forma sales” or “organic sales”
refers
to sales adjusted to exclude this impact of acquisitions and divestiture and the impact of the change to net revenue
reporting as discussed below. Management believes that providing this additional information is useful to the reader
to better assess and understand operating performance, especially when comparing results with previous periods or
forecasting performance for future periods, primarily because management typically monitors the business both
including and excluding these adjustments to GAAP results. Management also uses these non-GAAP measures to
establish operational goals and, in some cases, for measuring performance for compensation purposes. However,
analysis of results and outlook on a non-GAAP basis should be used as a complement to, and in conjunction with,
data presented in accordance with GAAP.
17
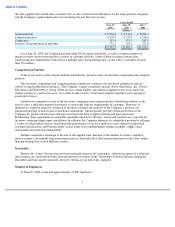
Note 18 in the
Notes to the Consolidated Financial Statements contained in Item 15 of this Report for further
discussion of these items).
(b)
Includes the impact of restructuring, integration and other items, gain on sale of assets, debt extinguishment costs
and other items which amounted to charges of $31.7 million pre-tax, $20.0 million after tax and $0.13 per share
on a diluted basis.
(c)
Includes the impact of restructuring, integration and other items, loss on sale of assets and debt extinguishment
costs (see Note 18 in the Notes to the Consolidated Financial Statements contained in Item 15 of this Report for
further discussion of these items). In addition, in comparison with fiscal 2005 and 2004, fiscal 2006 results
include incremental stock-based compensation expense resulting from the Company’s adoption of the Financial
Accounting Standards Board’s (“FASB”) Statement of Financial Accounting Standard (“SFAS”) 123R, Share-
based Payment (“SFAS 123R”), and modifications to stock-based compensation plans in fiscal 2006. The
incremental charges amounted to $16.6 million pre-tax, $10.6 million after tax, and $0.07 per share on a diluted
basis. The Company also incurred incremental amortization expense associated with amortizable intangible assets
recorded in fiscal 2006 as a result of the Memec acquisition which amounted to $4.2 million pre-
tax, $2.7 million
after tax and $0.02 per share on a diluted basis. The total impact of these charges amounted to $115.9 million pre-
tax, $83.9 million after tax and $0.57 per share on a diluted basis.
(d)
Includes the impact of restructuring, other charges and debt extinguishment costs, the total of which amounted to
$72.0 million pre
-
tax, $52.8 million after
-
tax and $0.44 per share on a diluted basis.
Item 7.
Management
’
s Discussion and Analysis of Financial Condition and Results of Operations