Avnet 2000 Annual Report Download - page 2
Download and view the complete annual report
Please find page 2 of the 2000 Avnet annual report below. You can navigate through the pages in the report by either clicking on the pages listed below, or by using the keyword search tool below to find specific information within the annual report.-
 1
1 -
 2
2 -
 3
3 -
 4
4 -
 5
5 -
 6
6 -
 7
7 -
 8
8 -
 9
9 -
 10
10 -
 11
11 -
 12
12 -
 13
13 -
14
-
15
-
16
-
17
-
18
-
19
-
20
-
21
-
22
-
23
-
24
-
25
-
26
-
27
-
28
-
29
-
30
-
31
-
32
-
33
 |
 |

$5.0
$7.0
$9.0
5.207
5.390
5.916
6.350
9.172
00
999897
96
SALES
(billions)
$1.75
$2.00
$2.25
00
999897
96
DILUTED EARNINGS
PER SHARE
*BEFORE SPECIAL ITEMS
DESCRIBED IN NOTES (A-C)
10.0%
12.5%
15.0%
00
999897
96
2.1513.3
8.4
10.5
12.0
11.2
2.12
1.54
2.11
2.06
RETURNS ON EQUITY
*BEFORE SPECIAL ITEMS
DESCRIBED IN NOTES (A-C)
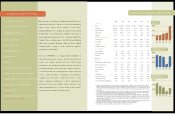
FINANCIAL REVIEW 1995- 2000
2000 1999 1998 1997 1996 1995
Income:
Sales $9,172.2 $6,350.0 $5,916.3 $5,390.6 $5,207.8 $4,300.0
Gross Profit 1,288.5(c) 948.6(b) 980.4(a) 961.8 969.1 816.4
Operating Income 334.0(c) 173.2(b) 271.2(a) 327.7 349.0 261.5
Income Taxes 109.4(c) 200.8(b) 115.9(a) 130.7 136.8 103.1
Earnings 145.1(c) 174.5(b) 151.4(a) 182.8 188.3 140.3
Financial Position:
Working Capital 1,969.5 1,517.5 1,461.3 1,319.0 1,293.9 1,057.1
Total Assets 5,244.4 2,984.7 2,733.7 2,594.1 2,521.7 2,125.6
Total Debt 1,937.9 791.5 810.9 514.6 497.5 419.5
Shareholders’ Equity 1,902.0 1,397.6 1,315.9 1,502.2 1,505.2 1,239.4
Per Share
(d)
:
Basic Earnings (e) 1.77(c) 2.45(b) 1.92(a) 2.15 2.17 1.72
Diluted Earnings (e) 1.75(c) 2.43(b) 1.90(a) 2.12 2.15 1.66
Dividends .30 .30 .30 .30 .30 .30
Book Value 21.53 19.85 18.05 18.28 17.34 15.19
Ratios:
Operating Income Margin on Sales 3.6%(c) 2.7%(b) 4.6%(a) 6.1% 6.7% 6.1%
Profit Margin on Sales 1.6%(c) 2.7%(b) 2.6%(a) 3.4% 3.6% 3.3%
Return on Equity 8.7%(c) 13.2%(b) 10.4%(a) 12.0% 13.3% 12.0%
Return on Capital 6.4%(c) 9.4%(b) 8.3%(a) 10.1% 11.0% 10.1%
Quick 1.0:1 1.6:1 1.6:1 1.5:1 1.6:1 1.6:1
Working Capital 2.0:1 2.9:1 3.4:1 3.3:1 3.5:1 3.3:1
Total Debt to Capital 50.5% 36.2% 38.1% 25.5% 24.8% 25.3%
Number of Employees 10,900 8,200 8,700 9,400 9,500 9,000
Sales Per Employee ($ Thousands)(f) 935 722 659 573 556 487
(a) Includes the net negative impact of $14.9 pre-tax and $12.5 after-tax ($0.16 per share on a diluted basis) for (i) the gain on the sale of Channel
Master of $33.8 pre-tax and $17.2 after-tax, (ii) costs relating to the divestiture of Avnet Industrial, the closure of the Company’s corporate head-
quarters in Great Neck, NY, and the anticipated loss on the sale of Company-owned real estate, amounting to $13.3 pre-tax and $8.5 after-tax, and
(iii) incremental special charges associated with the reorganization of the Company’s Electronics Marketing Group, amounting to $35.4 pre-tax and
$21.2 after-tax.
(b) Includes the net gain on exiting the printed catalog business recorded in the fourth quarter of fiscal year 1999 offset by special charges recorded in
the first quarter associated with the reorganization of the Company’s Electronics Marketing Group. The net positive effect on fiscal 1999 pre-tax
income, net income and diluted earnings per share were $183.0 million, $64.0 million, and $0.89, respectively.
(c) Includes special charges associated with (i) the integration of Marshall Industries, SEI Eurotronics and Macro into Electoronics Marketing (EM),
(ii) the integration of JBA Computer Solutions into Computer Marketing North America, (iii) the reorganization of EM Asia, (iv) the reorganization of
EM’s European operations including cost related to the consolidation of EM’s European warehousing operations and (v) costs incurred in connection
with certain litigation brought by the Company. The total special charges for fiscal 2000 amounted to $49.0 million pre-tax, $30.4 million after-tax
and $0.37 per share on a diluted basis.
(d)All share and per share data have been restated to reflect a two-for-one split of the Company’s common stock approved by the Board of Directors
on August 31, 2000 and to be distributed on September 28, 2000 to shareholders of record on September 18, 2000.
(e) Earnings per share have been restated to conform with the provisions of SFAS No. 128, “Earnings Per Share.”
(f) Calculated based on annual sales divided by the average number of employees during the period.
1
FINANCIAL REVIEW
1
SHAREHOLDERS’ LETTER
3
RESHAPING AVNET
FORGING THE FUTURE
9
GLOBALIZATION
11
THE INTERNET
13
COLLABORATION
17
INNOVATION
19
PEOPLE
21
AVNET APPLIED COMPUTING
22
AVNET COMPUTER MARKETING
24
AVNET ELECTRONICS MARKETING
28
DIRECTORS AND OFFICERS
33-34
FINANCIALS
35-62
SHAREHOLDERS’ INFORMATION
INSIDE BACK COVER
Major changes are redefining the distribution industry. This year’s
annual report describes the challenges, as well as the opportunities,
relative to those changes. Avnet continues to evolve from its
traditional distribution role, emerging as an innovator in the global
New Economy, a successful industry consolidator and a leader in
global supply-chain management for the electronics industry. The
Company’s three operating groups – Avnet Electronics Marketing
(EM), Avnet Computer Marketing (CM) and Avnet Applied
Computing (AAC) – continue to execute and innovate within the
global technology marketspace.
Avnet, Inc. (NYSE:AVT) is a leading authorized distributor of
semiconductors, interconnect, passive and electromechanical com-
ponents and computer products from the world’s premier
manufacturers. Avnet markets its suppliers’ products and services
to a substantially larger customer base than a supplier’s sales force
can efficiently handle. The Company provides design engineering
services, software/ hardware configuration and integration,
consulting and a vast array of value-added services, serving
original equipment manufacturers, contract manufacturers,
value-added resellers and computer system end-users. Avnet
employs approximately 11,000 talented people around the globe
and is headquartered in Phoenix, Arizona, U.S.A.
FORGING AVNET’S FUTURE