Avnet 2000 Annual Report Download - page 19
Download and view the complete annual report
Please find page 19 of the 2000 Avnet annual report below. You can navigate through the pages in the report by either clicking on the pages listed below, or by using the keyword search tool below to find specific information within the annual report.-
 1
1 -
2
-
3
-
4
-
5
-
6
-
7
-
8
-
 9
9 -
 10
10 -
 11
11 -
 12
12 -
 13
13 -
 14
14 -
 15
15 -
 16
16 -
 17
17 -
 18
18 -
 19
19 -
 20
20 -
 21
21 -
 22
22 -
 23
23 -
 24
24 -
 25
25 -
 26
26 -
 27
27 -
 28
28 -
 29
29 -
30
-
31
-
32
-
33
 |
 |

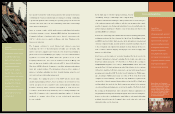
OFFICERS
MANAGEMENT BOARD
Name/ Years of service at Avnet
ROY VALLEE
-
23 years
Chairman and CEO
DAVID BIRK
-
19 years
Sr. Vice President, Secretary and
General Counsel
ANDREW S. BRYANT
-
18 years
Sr. Vice President
STEVEN C. CHURCH
-
9 years
Sr. Vice President
ANTHONY T. DELUCA
-
20 years
Sr. Vice President
BRIAN HILTON
-
3 years
Sr. Vice President
PATRICK JEWETT
- 18 years
Sr. Vice President
RAYMOND SADOWSKI
-
22 years
Sr. Vice President, Chief Financial
Officer and Asst. Secretary
BRIAN ARMSTRONG
- 17 years
Vice President
STEVEN J. BANDROWCZAK
-
11 years, Vice President
JOHN A. CARFORA
- 14 years
Vice President
JOHN T. CLARK
- 17 years
Vice President
HARLEY M. FELDBERG
- 18 years
Vice President
GREGORY A. FRAZIER
- 23 years
Vice President
PHILIP GALLAGHER
- 17 years
Vice President
RICHARD HAMADA
- 16 years
Vice President
LORI HARTMAN
- 16 years
Vice President
JOHN HOVIS
-
8 years
Vice President
STEVEN M. JOHN
- 10 years
Vice President
EDWARD KAMINS
-
3 years
Vice President
ARTHUR J. LEVY
- 10 years
Vice President, Deputy General Counsel
and Asst. Secretary
ALLEN MAAG
-
2 years
Vice President
JOSIAH NAPUA
- 1 year
Vice President
JAMES D. SHORT
- 26 years
Vice President
CHARLES SMITH
- 28 years
Vice President
GEORGE SMITH
- 22 years
Vice President
DONALD E. SWEET
- 34 years
Vice President
ROBERT ZIERK
- 16 years
Vice President
JOHN COLE
- 23 years
Controller
DAVID BIRK
ANDREW BRYANT
RAYMOND SADOWSKI
BRIAN HILTON
ED KAMINS
ANTHONY DELUCA
JOHN HOVIS
ROY VALLEE
JEAN FRIBOURG
STEVE CHURCH
GREG MONTE
KEVIN McGARITY
†
ANDREW McFARLANE
†
ALLEN MAAG
PHILIPPE SALA
†
RICHARD WARD
†
†Outside Management Board members
(Pictured left to right)
34
35
For an understanding of the significant factors that influenced the
Company’s performance during the past three fiscal years, the following
discussion should be read in conjunction with the consolidated financial
statements, including the related notes, and other information appearing
elsewhere in this Report. Reference herein to any particular year or quarter
generally refers to the Company’s fiscal year periods.
Effective as of the beginning of 1999, Avnet changed its organizational
structure to strengthen its focus on its core businesses and thereby better
meet the needs of both its customers and its suppliers. This change involved
dividing the former Electronics Marketing Group into its two major lines of
business: the distribution of electronic components and the distribution of
computer products. This change resulted in the creation of two operating
groups, Electronics Marketing (“EM”) and Computer Marketing (“CM”).
EM focuses on the global distribution of and value-added services associ-
ated with electronic components. CM focuses on middle- to high-end value-
added computer products distribution and related services. In addition, the
Company has a third operating group — Avnet Applied Computing (“AAC”)
— which began operating in the Americas effective as of the beginning of
the second quarter of 2000 and in Europe effective as of the beginning of
the third quarter of 2000. AAC, which was created by combining certain
segments from EM’s and CM’s operations, provides leading-edge technolo-
gies such as microprocessors to system integrators and manufacturers of
general purpose computers, and provides design, integration, marketing
and financial services to developers of application-specific computer solu-
tions. AAC-type activities in Asia are still included as part of EM. It is
expected that these operations will be included as part of AAC as of the
beginning of 2001. References below under “Results of Operations” to
“EM”, “CM” and “AAC” are to the new group structure. The results for AAC
in the Americas and Europe prior to the beginning of the second and third
quarters of 2000, respectively, are included in EM and CM as the results of
the operating groups have not been restated. Therefore, the group informa-
tion supplied below for 2000 is not comparable to the information for prior
periods.
The results for 2000 included the impact of the Company’s October 20,
1999 acquisition of Marshall Industries, the largest acquisition in the histo-
ry of the electronics components distribution industry, which is more fully
described in the “Acquisitions” section to follow in this Management’s
Discussion and Analysis of Financial Condition and Results of Operations
(“MD&A”). Marshall Industries has been merged primarily into EM with a
relatively small portion having been merged into AAC.
On August 31, 2000, the Company’s Board of Directors declared a two-for-
one stock split to be effected in the form of a stock dividend (the “Stock
Split”). The additional common stock will be distributed on September 28,
2000 to shareholders of record on September 18, 2000. All references in
this MD&A, and elsewhere in this Report, to the number of shares, per
share amounts
and market prices of the Company’s common stock have
been restated to reflect the stock split and the resulting increased
number of
shares outstanding.
RESULTS OF OPERATIONS
Sales
Consolidated sales were a record $9.172 billion in 2000, up 44% as com-
pared with sales of $6.350 billion in 1999. A significant portion of the
increase in sales was due to the acquisitions in 2000 of Marshall Industries,
Eurotronics B.V. (SEI) and the SEI Macro Group. EM’s sales, which repre-
sent 72.4% of consolidated sales, were a record $6.638 billion in 2000, up
38% as compared with sales of $4.795 billion in 1999. This increase in sales
was due primarily to the impact of acquisitions and the strengthening of
business conditions in the electronics component distribution market. As far
as EM’s sales by region are concerned, EM Americas’ sales in 2000 of
$4.694 billion were up 36% as compared with the prior year, while EM
EMEA’s 2000 sales were up over 37% and EM Asia’s sales were up approx-
imately 82% as compared with 1999. CM’s sales, which represented 20.3%
of consolidated sales, were $1.864 billion in 2000, up almost 20% as com-
pared with 1999 sales of $1.555 billion. Avnet’s newly formed group, AAC,
recorded sales of $670 million in 2000, or 7.3% of consolidated sales. In
addition, EM’s and CM’s sales for 2000 as indicated above include $368
million of AAC sales recorded prior to the period when AAC was separated
into a separate group, making AAC’s global sales approximately $1.038 bil-
lion on a pro forma basis for 2000.
Consolidated sales were $6.350 billion in 1999, up 7% as compared with sales
of $5.916 billion in 1998. EM’s sales of $4.795 billion in 1999 were up over 7%
as compared with $4.474 billion in 1998, and CM’s sales of $1.555 billion in
1999 were up almost 11% as compared with $1.404 billion in 1998. EM
Americas’ sales in 1999 of $3.451 billion were up over 4% as compared with the
prior year, while EM EMEA’s 1999 sales were up over 10% and EM Asia’s sales
were up 49% due in part to sales of newly-acquired businesses. Consolidated
sales also benefited from the extra week of operations in 1999 as compared
with 1998 due to the Company’s “52/ 53 week” fiscal calendar. (See Note 1 to
the Consolidated Financial Statements appearing elsewhere in this Report.)
MANAGEMENT’S DISCUSSION AND ANALYSIS OF
FINANCIAL CONDITION AND RESULTS OF OPERATIONS