Avid 2000 Annual Report Download - page 2
Download and view the complete annual report
Please find page 2 of the 2000 Avid annual report below. You can navigate through the pages in the report by either clicking on the pages listed below, or by using the keyword search tool below to find specific information within the annual report.-
 1
1 -
 2
2 -
 3
3 -
 4
4 -
 5
5 -
 6
6 -
 7
7 -
 8
8 -
 9
9 -
 10
10 -
 11
11 -
 12
12 -
 13
13 -
14
-
15
-
16
-
17
-
18
-
19
-
20
-
21
-
22
-
23
-
24
-
25
-
26
-
27
-
28
-
29
-
30
-
31
-
32
-
33
-
34
-
35
-
36
-
37
-
38
-
39
-
40
-
41
-
42
-
43
-
44
-
45
-
46
-
47
-
48
-
49
-
50
-
51
-
52
-
53
-
54
-
55
-
56
-
57
-
58
-
59
-
60
-
61
-
62
-
63
-
64
 |
 |

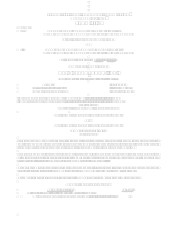
FINANCIAL HIGHLIGHTS
Avid’s Executive Team From Left to Right:
Carol L. Reid Vice President and Corporate Controller
Paul J. Milbury Vice President and Chief Financial Officer
Charles L. Smith Vice President of Worldwide Sales, Marketing and Service
Ann C. Smith Vice President of Human Resources and Corporate Services
David A. Krall President and Chief Executive Officer
Eric C. Peters Vice President and Chief Scientist
Michael J. Rockwell Vice President and Chief Technology Officer; General Manager, Avid Internet Solutions
Ethan E. Jacks Vice President of Business Development and Chief Legal Officer
Joseph Bentivegna Vice President and General Manager, Avid Media Solutions
David R. Froker Vice President and General Manager, Digidesign
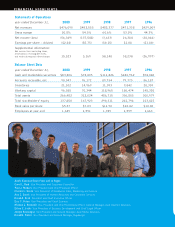
Statements of Operations
year ended December 31, 2000 1999 1998 1997 1996
Net revenues $476,090 $452,555 $482,377 $471,338 $429,009
Gross margin 50.8% 54.5% 60.6% 53.0% 44.3%
Net income (loss) (56,349) (137,548) (3,633) 26,384 (38,044)
Earnings per share – diluted ($2.28) ($5.75) ($0.15) $1.08 ($1.80)
Supplemental information:
Net income (loss) excluding taxes,
amortization of intangible assets,
and restructuring and other charges 15,523 3,169 58,148 38,238 (26,997)
Balance Sheet Data
year ended December 31, 2000 1999 1998 1997 1996
Cash and marketable securities $83,206 $72,805 $111,826 $186,962 $94,040
Accounts receivable, net 90,047 76,172 89,754 79,773 86,187
Inventories 21,102 14,969 11,093 9,842 28,359
Working capital 96,585 70,344 118,965 186,474 145,320
Total assets 266,482 312,024 486,715 356,805 300,979
Total stockholders’ equity 137,850 167,923 290,311 241,794 213,415
Book value per share $5.37 $7.03 $11.90 $10.42 $10.00
Employees at year end 1,629 1,591 1,929 1,599 1,663