Audiovox 1999 Annual Report Download - page 14
Download and view the complete annual report
Please find page 14 of the 1999 Audiovox annual report below. You can navigate through the pages in the report by either clicking on the pages listed below, or by using the keyword search tool below to find specific information within the annual report.-
 1
1 -
2
-
3
-
 4
4 -
 5
5 -
 6
6 -
 7
7 -
 8
8 -
 9
9 -
 10
10 -
 11
11 -
 12
12 -
 13
13 -
 14
14 -
 15
15 -
 16
16 -
 17
17 -
 18
18 -
 19
19 -
 20
20 -
 21
21 -
 22
22 -
 23
23 -
 24
24 -
25
-
26
-
27
-
28
-
29
-
30
-
31
-
32
-
33
-
34
-
35
-
36
-
37
-
38
-
39
-
40
 |
 |

AUDIOVOX
12
During this period, the Company’s unit gross profit margin declined
due to continued strong competition and increased sales of digital hand-
sets, which have a lower gross profit margin percentage than analog
handsets. Despite the margin decline, the Company’s gross margin dollars
increased significantly due to the large increases in net sales.
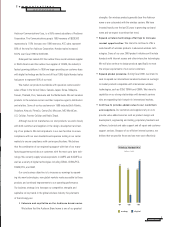
Sales by the Electronics Group were $188.4 million in 1996 and
$193.9 million in 1997, but declined in 1998 to $175.1 million, primarily
due to a financial crisis in Asia, particularly Malaysia. Sales for fiscal
1999 have increased 31% to $230.2 million over fiscal 1998. During this
period, the Company’s sales were impacted by the following items:
• the growth of our consumer electronic products business from $2.9 mil-
lion in fiscal 1996 to $38.2 million in fiscal 1999
• the introduction of mobile video entertainment systems and other new
technologies
• the Asian financial crisis in 1998
Gross margins in the Company’s electronics business increased from
18.9% in 1996 to 20.3% for fiscal 1999 due, in part, to higher margins in
mobile video products and other new technologies and products.
The Company’s total operating expenses have not increased materi-
ally since 1996, despite its increase in sales. Total operating expenses
were $83.3 million in 1996 and $96.4 million in 1999. The Company has
invested in management systems and improved its operating facilities to
increase its efficiency.
During the period 1996 to 1999, the Company’s balance sheet was
strengthened by the conversion of $63 million of its $65 million 61⁄4% sub-
ordinated convertible debentures due 2001 into approximately 9.7 million
shares of Class A common stock and the net gain of $23.2 million from
the sale of CellStar stock held by the Company.
All financial information, except share data, is presented in thousands.
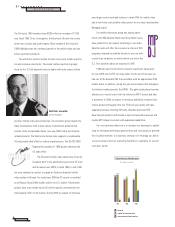
Results of Operations
The following table sets forth for the periods indicated certain
statements of income data for the Company expressed as a percentage of
net sales:
Percentage of Net Sales
Years Ended November 30,
1997 1998 1999
Net sales:
Wireless
Wireless products...................................... 62.1% 65.3% 76.5%
Activation commissions............................. 4.9 3.7 2.2
Residual fees ............................................. 0.7 0.7 0.3
Other........................................................... 1.9 1.9 1.1
Total Wireless........................................ 69.6 71.6 80.1
Electronics
Sound ......................................................... 14.4 12.7 6.8
Mobile electronics..................................... 15.2 13.8 9.8
Consumer electronics ................................ 0.7 1.9 3.3
Total Electronics..................................... 30.3 28.4 19.9
Other............................................................... 0.1 — —
Total net sales........................................ 100.0 100.0 100.0
Cost of sales ...................................................... (83.3) (85.6) (88.4)
Gross profit ........................................................ 16.7 14.4 11.6
Selling ................................................................ (6.0) (5.7) (3.2)
General and administrative ............................... (5.8) (5.9) (3.8)
Warehousing, assembly and repair................... (1.9) (2.0) (1.3)
Total operating expenses....................... (13.7) (13.6) (8.3)
Operating income............................................... 3.0 0.8 3.3
Interest and bank charges ................................. (0.4) (0.8) (0.4)
Income in equity investments, management
fees and related income, net......................... 0.2 0.2 0.3
Gain on sale of investments.............................. 5.9 0.1 0.3
Gain on issuance of subsidiary shares.............. — — 0.3
Debt conversion expense................................... (2.0) — —
Other income (expense)..................................... — 0.3 (0.2)
Provision for income taxes ................................ (3.5) (0.1) (1.3)
Net income......................................................... 3.3% 0.5% 2.3%
The net sales and percentage of net sales by product line and marketing group for the fiscal years ended November 30, 1997, 1998 and 1999 are
reflected in the following table. Certain reclassifications and recaptionings have been made to the data for periods prior to fiscal 1999 in order to conform
to fiscal 1999 presentation.
Fiscal Year Ended November 30,
1997 1998 1999
(Dollars in thousands)
Net sales:
Wireless
Wireless products .................................................................................................... $396,510 62.1% $402,606 65.3% $ 886,509 76.5%
Activation commissions ........................................................................................... 31,061 4.9 22,785 3.7 25,873 2.2
Residual fees............................................................................................................ 4,688 0.7 4,452 0.7 3,674 0.3
Other......................................................................................................................... 12,141 1.9 11,747 1.9 13,247 1.1
Total Wireless....................................................................................................... 444,400 69.6 441,590 71.6 929,303 80.1
Electronics
Sound........................................................................................................................ 91,763 14.4 78,338 12.7 78,713 6.8
Mobile electronics.................................................................................................... 97,446 15.2 84,973 13.8 113,371 9.8
Consumer electronics............................................................................................... 4,701 0.7 11,794 1.9 38,150 3.3
Total Electronics ................................................................................................... 193,910 30.3 175,105 28.4 230,234 19.9
Other............................................................................................................................. 772 0.1 — — — —
Total ...................................................................................................................... $639,082 100.0% $616,695 100.0% $1,159,537 100.0%
Management’s Discussion and
ANALYSIS OF FINANCIAL CONDITION AND
RESULTS OF OPERATIONS (continued) Audiovox Corporation and Subsidiaries