Atmos Energy 2002 Annual Report Download - page 6
Download and view the complete annual report
Please find page 6 of the 2002 Atmos Energy annual report below. You can navigate through the pages in the report by either clicking on the pages listed below, or by using the keyword search tool below to find specific information within the annual report.-
 1
1 -
 2
2 -
 3
3 -
 4
4 -
 5
5 -
 6
6 -
 7
7 -
 8
8 -
 9
9 -
 10
10 -
 11
11 -
 12
12 -
 13
13 -
 14
14 -
 15
15 -
 16
16 -
 17
17 -
18
-
19
-
20
-
21
-
22
-
23
-
24
-
25
-
26
-
27
-
28
-
29
-
30
-
31
-
32
-
33
-
34
-
35
-
36
-
37
-
38
-
39
-
40
-
41
-
42
 |
 |

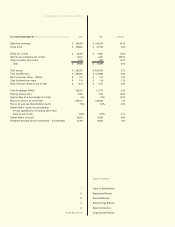
Year ended September 30 (Dollars in thousands, except per share data) 2002 2001 Change
Operating revenues $950,849 $ 1,442,275 -34.1%
Gross profit $392,602 $ 374,720 4.8%
Utility net income $42,994 $ 49,881 -13.8%
Natural gas marketing net income 12,614 2,551 394.5%
Other nonutility net income 4,048 3,658 10.7%
Total $59,656 $ 56,090 6.4%
Total assets $1,980,221 $ 2,036,180 -2.7%
Total capitalization $1,243,698 $ 1,276,263 -2.6%
Net income per share – diluted $1.45 $ 1.47 -1.4%
Cash dividends per share $1.18 $ 1.16 1.7%
Book value per share at end of year $13.75 $ 14.31 -3.9%
Total throughput (MMcf) 208,541 217,774 -4.2%
Heating degree days 3,368 4,124 -18.3%
Degree days as a percentage of normal 94% 115% -18.3%
Meters in service at end of year 1,389,341 1,386,323 .2%
Return on average shareholders’ equity 9.9% 10.4% -4.8%
Shareholders’ equity as a percentage
of total capitalization (including short-term
debt) at end of year 40.6% 39.0% 4.1%
Shareholders of record 28,829 30,524 -5.6%
Weighted average shares outstanding – diluted (000s) 41,250 38,247 7.9%
Table of Contents
3Letter to Shareholders
18 Operational Review
26 Financial Review
35 Atmos Energy Officers
36 Board of Directors
Inside Back Cover Corporate Information
FINANCIAL HIGHLIGHTS