Atmos Energy 2000 Annual Report Download - page 9
Download and view the complete annual report
Please find page 9 of the 2000 Atmos Energy annual report below. You can navigate through the pages in the report by either clicking on the pages listed below, or by using the keyword search tool below to find specific information within the annual report.-
 1
1 -
 2
2 -
 3
3 -
 4
4 -
 5
5 -
 6
6 -
 7
7 -
 8
8 -
 9
9 -
 10
10 -
 11
11 -
 12
12 -
 13
13 -
 14
14 -
 15
15 -
 16
16 -
 17
17 -
 18
18 -
 19
19 -
 20
20 -
21
-
22
-
23
-
24
-
25
-
26
-
27
-
28
-
29
-
30
-
31
-
32
-
33
-
34
-
35
-
36
-
37
-
38
 |
 |

5
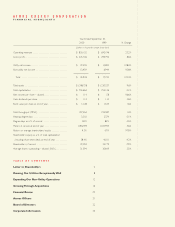
........
conditions. We believe these
steps have positioned the
Company to deliver strong
earnings growth going for-
ward, even when weather
is warmer than normal.
Striving for
Exceptional
Customer
Service
In addition to increasing the
numbers of customers we
serve, we have also continued our
efforts to deliver exceptional customer
service at the lowest possible cost. By
continually improving our technology
systems and our business processes and
training, we have remained among the
most efficient operators in the industry.
Our operating and maintenance costs of
$135 per meter highlights our efficiency
and was once again lower than the indus-
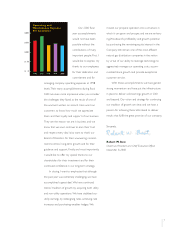
try average of $220 per meter. In addition, we served
582 customers per employee, up significantly
from last year’s average of 523
customers per
employee, and again better than the average of
390 customers per employee for our peer
companies.
We continually work to improve our efficiency
and customer service at our Customer Support
Center which provides customer call support 24
hours a day, seven days a week.The center now
handles more than 7,000 calls per day collectively
for our five utility business units.
As we move into the future, technology will
continue to transform
our business. More
sophisticated technol-
ogy has already made
it possible to read our
customers’ meters
using hand-held elec-
tronic meter reading
equipment and to dis-
patch service orders
directly to the field
through laptop computers located in our service
technicians’ vehicles.
Customers Per
Employee
600
500
400
300
200
100
0
2000199919981997
1996