Atmos Energy 2000 Annual Report Download - page 3
Download and view the complete annual report
Please find page 3 of the 2000 Atmos Energy annual report below. You can navigate through the pages in the report by either clicking on the pages listed below, or by using the keyword search tool below to find specific information within the annual report.-
 1
1 -
 2
2 -
 3
3 -
 4
4 -
 5
5 -
 6
6 -
 7
7 -
 8
8 -
 9
9 -
 10
10 -
 11
11 -
 12
12 -
 13
13 -
 14
14 -
15
-
16
-
17
-
18
-
19
-
20
-
21
-
22
-
23
-
24
-
25
-
26
-
27
-
28
-
29
-
30
-
31
-
32
-
33
-
34
-
35
-
36
-
37
-
38
 |
 |

..................................................................................................................
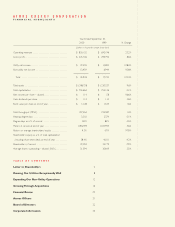
ATMOS ENERGY CORPORATION
FINANCIAL HIGHLIGHTS
Year Ended September 30,
2000 1999 % Change
(Dollars in thousands, except share data)
Operating revenues . . . . . . . . . . . . . . . . . . . . . . . . . . . . . . . $ 850,152 $ 690,196 23.2%
Gross profit . . . . . . . . . . . . . . . . . . . . . . . . . . . . . . . . . . . . . . $ 325,706 $ 299,794 8.6%
Utility net income . . . . . . . . . . . . . . . . . . . . . . . . . . . . . . . . . $ 22,459 $ 10,800 108.0%
Non-utility net income . . . . . . . . . . . . . . . . . . . . . . . . . . . . 13,459 6,944 93.8%
Total
. . . . . . . . . . . . . . . . . . . . . . . . . . . . . . . . . . . . . . . . . $ 35,918 $ 17,744 102.4%
Total assets . . . . . . . . . . . . . . . . . . . . . . . . . . . . . . . . . . . . . . $1,348,758 $ 1,230,537 9.6%
Total capitalization . . . . . . . . . . . . . . . . . . . . . . . . . . . . . . . . $ 755,664 $ 755,146 0.1%
Net income per share – diluted . . . . . . . . . . . . . . . . . . . . . $ 1.14 $ .58 96.6%
Cash dividends per share . . . . . . . . . . . . . . . . . . . . . . . . . . $ 1.14 $ 1.10 3.6%
Book value per share at end of year . . . . . . . . . . . . . . . . . $ 12.28 $ 12.09 1.6%
Total throughput (MMcf) . . . . . . . . . . . . . . . . . . . . . . . . . . . 197,564 195,587 1.0%
Heating degree days . . . . . . . . . . . . . . . . . . . . . . . . . . . . . . 3,302 3,374 -2.1%
Degree days as a % of normal . . . . . . . . . . . . . . . . . . . . . 82% 85% -3.5%
Meters in service at end of year . . . . . . . . . . . . . . . . . . . . 1,096,599 1,037,995 5.6%
Return on average shareholders’ equity . . . . . . . . . . . . . . 9.3% 4.7% 97.9%
Shareholders’ equity as a % of total capitalization
(including short-term debt) at end of year . . . . . . . . . . 38.4% 40.1% -4.2%
Shareholders of record . . . . . . . . . . . . . . . . . . . . . . . . . . . 32,394 35,179 -7.9%
Average shares outstanding – diluted (000’s) . . . . . . . . . . 31,594 30,819 2.5%
TABLE OF CONTENTS
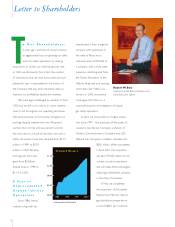
Letter to Shareholders 2
Running Our Utilities Exceptionally Well 8
Expanding Our Non-Utility Operations 12
Growing Through Acquisitions 16
Financial Review 22
Atmos Officers 31
Board of Directors 32
Corporate Information 33