Atari 2012 Annual Report Download - page 7
Download and view the complete annual report
Please find page 7 of the 2012 Atari annual report below. You can navigate through the pages in the report by either clicking on the pages listed below, or by using the keyword search tool below to find specific information within the annual report.-
 1
1 -
 2
2 -
 3
3 -
 4
4 -
 5
5 -
 6
6 -
 7
7 -
 8
8 -
 9
9 -
 10
10 -
 11
11 -
 12
12 -
 13
13 -
 14
14 -
 15
15 -
 16
16 -
 17
17 -
 18
18 -
19
-
20
-
21
-
22
-
23
-
24
-
25
-
26
-
27
-
28
-
29
-
30
-
31
-
32
-
33
-
34
-
35
-
36
-
37
-
38
-
39
-
40
-
41
-
42
-
43
-
44
-
45
-
46
-
47
-
48
-
49
-
50
-
51
-
52
-
53
-
54
-
55
-
56
-
57
-
58
-
59
-
60
-
61
-
62
-
63
-
64
-
65
-
66
-
67
-
68
-
69
-
70
-
71
-
72
-
73
-
74
-
75
-
76
-
77
-
78
-
79
-
80
-
81
-
82
-
83
-
84
-
85
-
86
-
87
-
88
-
89
-
90
-
91
-
92
-
93
-
94
-
95
-
96
-
97
-
98
-
99
-
100
-
101
-
102
-
103
-
104
-
105
-
106
-
107
-
108
-
109
-
110
-
111
-
112
-
113
-
114
-
115
-
116
-
117
-
118
-
119
-
120
-
121
-
122
-
123
-
124
-
125
-
126
-
127
-
128
-
129
-
130
-
131
-
132
-
133
-
134
-
135
-
136
-
137
-
138
-
139
-
140
 |
 |

ANNUAL FINANCIAL REPORT – REGISTRATION DOCUMENT
7
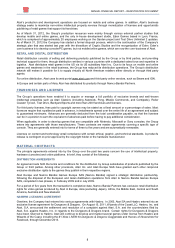
Worldwide Digital Game Revenues in billions of $ as per IDG (October 2011)
* Including Apple mobiles, Android-based, other smartphone, feature phones
** Including Apple iPad and other tablets
*** Including PC full game downloads, cloud gaming, MMOs, social games, casual games, online console/HH, rental
MOBILE, TABLETS AND SMARTPHONE GAME MARKET
Mobile games are video games played on mobile phones, smartphones, tablets, portable media players and do not
include games played on dedicated handheld consoles.
As per IDG’s October 2011 analysis, the main revenue streams for mobile and tablets are monetized through paid
application revenues, virtual goods revenues, advertising revenues and to a lesser extent subscription revenues.
The mobile market is benefiting from the fast penetration rate of the smartphone (mainly iOS and Android devices) install
base which reached approximately 485 million devices at the end of 2011 while most of these devices merely existed in
2007. The tablet market is also benefiting from a very high and fast penetration rate. The iPad from Apple was launched
in April 2010. On June 25, 2011 the iPad Global installed based amounted to 28.7 million units.
The rapid expansion of the last generation of mobile devices (Smartphone and Tablets) has been supplemented by the
rise of the “App,” typically a small, specialized program downloaded onto mobile devices. At this stage, Atari games are
mainly distributed through the leading App portals which are Apple’s App store and the Android App market.
ONLINE
Several kinds of games can be played online, ranging from casual to expert, on various platforms including PCs and
game consoles (XBLA and PSN).
The main categories of online games are:
PC full games downloads,
Casual and social games, on all platforms, which are easy to play and can be quickly accessed free of
charge using an Internet browser;
Online Massively Multiplayer Games
Cloud games (mainly through OnLive and Gaikai);
And online Console (though Microsoft Xbox Live, Sony PlayStation Network, Nintendo WiiWare, DSiWare).
In addition to playing games online using PCs, consumers increasingly connect to the Internet through game consoles
(XBLA and PSN). The Internet provides a way to offer consumers immediate services and content.
Online games generate revenue from one or more of the following main sources:
full game downloads;
micro transactions, in which gamers with a free or purchased game are offered additional content or virtual
goods (most frequently new functionalities or access to more areas or levels);
online advertising;
subscription fees, generally monthly or quarterly;
pay per minute revenue;
Try-and-buy transactions.
Thus, video games are increasingly becoming a service to which players can have access whenever they want, with
content available online. According to the October 2011 IDG analysis, social and casual games were expected to reach
$4.52 billion in 2011, an increase of approximately 25% over 2010, and they were expected to grow by approximately
12% per year from 2010 to 2015.
BUSINESS
Atari (www.atari.com) is a multi-platform, global interactive entertainment and licensing company.
PUBLISHING, PRODUCTION, DEVELOPMENT AND MONETIZATION OF LICENSES
Publishing requires analyzing and segmenting markets, identifying consumer expectations, and assembling a product
offering consistent with demand, and then marketing products accordingly.
in billion of $
2010 2011E2015E
2010/2011
growth
2010/2015
CAGR
Mobile* 4.12 5.03 9.32 22.1% 17.7%
Tablet** 0.07 0.34 2.44 385.7% 103.5%
Total mobile + tablet 4.19 5.37 11.76 28.2% 22.9%
Online*** 16.57 20.04 30.54 20.9% 13.0%
TOTAL DIGITAL GAMING 20.76 25.41 42.3 22.4% 15.3%