Atari 2012 Annual Report Download - page 12
Download and view the complete annual report
Please find page 12 of the 2012 Atari annual report below. You can navigate through the pages in the report by either clicking on the pages listed below, or by using the keyword search tool below to find specific information within the annual report.-
 1
1 -
 2
2 -
 3
3 -
 4
4 -
 5
5 -
 6
6 -
 7
7 -
 8
8 -
 9
9 -
 10
10 -
 11
11 -
 12
12 -
 13
13 -
 14
14 -
 15
15 -
 16
16 -
 17
17 -
 18
18 -
 19
19 -
 20
20 -
 21
21 -
 22
22 -
23
-
24
-
25
-
26
-
27
-
28
-
29
-
30
-
31
-
32
-
33
-
34
-
35
-
36
-
37
-
38
-
39
-
40
-
41
-
42
-
43
-
44
-
45
-
46
-
47
-
48
-
49
-
50
-
51
-
52
-
53
-
54
-
55
-
56
-
57
-
58
-
59
-
60
-
61
-
62
-
63
-
64
-
65
-
66
-
67
-
68
-
69
-
70
-
71
-
72
-
73
-
74
-
75
-
76
-
77
-
78
-
79
-
80
-
81
-
82
-
83
-
84
-
85
-
86
-
87
-
88
-
89
-
90
-
91
-
92
-
93
-
94
-
95
-
96
-
97
-
98
-
99
-
100
-
101
-
102
-
103
-
104
-
105
-
106
-
107
-
108
-
109
-
110
-
111
-
112
-
113
-
114
-
115
-
116
-
117
-
118
-
119
-
120
-
121
-
122
-
123
-
124
-
125
-
126
-
127
-
128
-
129
-
130
-
131
-
132
-
133
-
134
-
135
-
136
-
137
-
138
-
139
-
140
 |
 |

ANNUAL FINANCIAL REPORT – REGISTRATION DOCUMENT
12
GROUP PREMISES
The Company’s headquarters are based in Paris, 78 rue Taitbout, 75 009 Paris – France as authorized by the
Extraordinary Shareholders Meeting of September 30, 2010.
Atari Group also has premises in Lyon, Los Angeles and New York.
For Fiscal Year 2011/2012, Group rent expenses amounted to approximately €1.0 million. In March and April 2012, the
Company moved its Lyon and New York offices into cheaper and smaller locations.
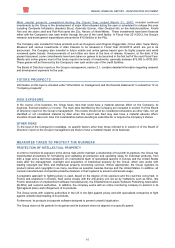
IMPLIFIED GROUP ORGANIZATION CHART AS OF MARCH 31, 2012
INFORMATION ON MANAGEMENT AND THE FINANCIAL ST ATEMENTS
Year ended March 31, 2012
BOARD OF DIRECTORS’ REPORT ON THE GROUP’S MANAGEMENT
1. ECONOMIC ENVIRONMENT AND HIGHLIGHTS OF THE YEAR
1.1. ECONOMIC ENVIRONMENT
Atari (“the Company" or “the Group”) is a multi-platform, global interactive entertainment and licensing company. Atari
owns and/or manages a portfolio of more than 200 games and franchises. Atari capitalizes on these popular properties
by delivering compelling games online (i.e. browser, Facebook®, and digital download), and on smartphones, tablets,
and other connected devices.
In an analysis dated August 2011, IDG estimates that worldwide non-traditional game market (including, mobile, tablets,
PC fill game downloads, social gaming, MMOs casual gaming and online console gaming) was expecting to raise USD
26.3 billion in 2011, representing 24.6% increase when compared to 2010.
Mobile gaming segment was expecting to reach USD 5.0 billion, representing a 22.1% increase when compared to 2010.
Social gaming would reach USD 2.0 billion, representing a 43.5% increase year on year, when compared to 2010, casual
games were expected to increase by 15.0% to USD 2.3 billion when compared to 2010.
Worldwide Digital Game Revenues in billions of $ as per IDG (October 2011):
* Including Apple mobiles, Android-based, other smartphone, feature phones
** Including Apple iPad and other tablets
*** Including PC full game downloads, cloud gaming, MMOs, social games, casual games, online console/HH, rental
Atari S.A.
France-- Holding
Atari Interactive Inc.
Production -
Publishing US - 100%
California US
Holding Inc.
Holding - US - 100%
Humongous Inc.
Publishing - US - 100%
Atari Inc.
Publishing - Distribution
- US - 100%
Atari Europe SAS
Publishing - France -
100%
Atari UK Publishing ltd
Production - UK - 100%
Eden Games SAS
Production - France -
100%
Atari Japan KK
Distribution - Japan -
100%
in billion of $
2010 2011E2015E
2010/2011
growth
2010/2015
CAGR
Mobile* 4.12 5.03 9.32 22.1% 17.7%
Tablet** 0.07 0.34 2.44 385.7% 103.5%
Total mobile + tablet 4.19 5.37 11.76 28.2% 22.9%
Online*** 16.57 20.04 30.54 20.9% 13.0%
TOTAL DIGITAL GAMING 20.76 25.41 42.3 22.4% 15.3%