American Home Shield 2003 Annual Report Download - page 2
Download and view the complete annual report
Please find page 2 of the 2003 American Home Shield annual report below. You can navigate through the pages in the report by either clicking on the pages listed below, or by using the keyword search tool below to find specific information within the annual report.-
 1
1 -
 2
2 -
 3
3 -
 4
4 -
 5
5 -
 6
6 -
 7
7 -
 8
8 -
 9
9 -
 10
10 -
 11
11 -
 12
12 -
 13
13 -
14
-
15
-
16
-
17
-
18
-
19
-
20
-
21
-
22
-
23
-
24
-
25
-
26
-
27
-
28
-
29
-
30
-
31
-
32
-
33
-
34
-
35
-
36
-
37
-
38
-
39
-
40
-
41
-
42
-
43
-
44
-
45
-
46
-
47
-
48
-
49
-
50
-
51
-
52
-
53
-
54
-
55
-
56
-
57
-
58
-
59
-
60
-
61
-
62
-
63
-
64
-
65
-
66
 |
 |

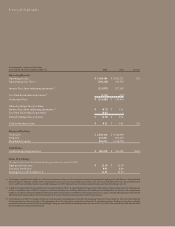
(In thousands, except per share data)
As of and for the years ended December 31 2003 2002 Change
Operating Results
Operating revenue $ 3,568,586 $ 3,500,721 2%
Operating income (loss)(1) (166,243) 335,393
Income (loss) from continuing operations(1,2) (221,975) 157,303
Loss from discontinued operations(3) (2,712) (309)
Net income (loss) $ (224,687) $ 156,994
Diluted earnings (loss) per share:
Income (loss) from continuing operations(1,2) $ (0.75) $ 0.51
Loss from discontinued operations(3) (0.01) –
Diluted earnings (loss) per share $ (0.76) $ 0.51
Cash dividends per share $ 0.42 $ 0.41 2%
Financial Position
Total assets $ 2,956,426 $ 3,414,938
Total debt 819,271 835,475
Shareholders’equity 816,517 1,218,700
Cash Flows
Cash from operating activities $ 283,538 $ 374,191 (24%)
Share Price Range
(Traded on the New York Stock Exchange under the symbol SVM)
High price for the year $ 12.10 $ 15.50
Low price for the year 8.95 8.89
Closing price as of December 31, 11.65 11.10
(1) The Company’s goodwill and intangible assets that are not amortized are subject to at least an annual assessment for impairment by applying a fair-value based test. During the third
quarter of 2003, the Company recorded a non-cash impairment charge associated with goodwill and intangible assets at its American Residential Services, American Mechanical
Services and TruGreen LandCare business units of $481 million pre-tax ($383 million after-tax). The impact on diluted earnings per share of this charge was $1.30.
(2) In 2003, the Company adopted Statement of Financial Accounting Standards (SFAS) 145, which eliminated the requirement to report all material gains and losses from the extinguishment
of debt as extraordinary items. In 2002, the Company recorded an extraordinary loss of $.03 per diluted share ($15 million pre-tax,$9 million after-tax) from the early extinguishment
of debt. As a result of the Company’s adoption of SFAS 145 in 2003, this loss has been reclassified into continuing operations interest expense,thereby reducing the previously reported
2002 income from continuing operations and related diluted earnings per share from continuing operations by the same amount.
(3) In the third quarter of 2003, the Company sold the assets and related operational obligations of the utility line clearing operations of TruGreen LandCare. The results of the utility line
clearing operations have been reclassified as “Discontinued operations”for all periods presented and are not included in continuing operations. Earnings per share from continuing
operations in 2002 were reduced $.01 and correspondingly earnings per share from discontinued operations were increased by $.01 to reflect the reclassification of the divested utility
line clearing business as discontinued operations.
Financial Highlights