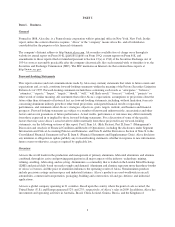
Alcoa 2009 Annual Report Download - page 2
Download and view the complete annual report
Please find page 2 of the 2009 Alcoa annual report below. You can navigate through the pages in the report by either clicking on the pages listed below, or by using the keyword search tool below to find specific information within the annual report.-
 1
1 -
 2
2 -
 3
3 -
 4
4 -
 5
5 -
 6
6 -
 7
7 -
 8
8 -
 9
9 -
 10
10 -
 11
11 -
 12
12 -
 13
13 -
14
-
15
-
16
-
17
-
18
-
19
-
20
-
21
-
22
-
23
-
24
-
25
-
26
-
27
-
28
-
29
-
30
-
31
-
32
-
33
-
34
-
35
-
36
-
37
-
38
-
39
-
40
-
41
-
42
-
43
-
44
-
45
-
46
-
47
-
48
-
49
-
50
-
51
-
52
-
53
-
54
-
55
-
56
-
57
-
58
-
59
-
60
-
61
-
62
-
63
-
64
-
65
-
66
-
67
-
68
-
69
-
70
-
71
-
72
-
73
-
74
-
75
-
76
-
77
-
78
-
79
-
80
-
81
-
82
-
83
-
84
-
85
-
86
-
87
-
88
-
89
-
90
-
91
-
92
-
93
-
94
-
95
-
96
-
97
-
98
-
99
-
100
-
101
-
102
-
103
-
104
-
105
-
106
-
107
-
108
-
109
-
110
-
111
-
112
-
113
-
114
-
115
-
116
-
117
-
118
-
119
-
120
-
121
-
122
-
123
-
124
-
125
-
126
-
127
-
128
-
129
-
130
-
131
-
132
-
133
-
134
-
135
-
136
-
137
-
138
-
139
-
140
-
141
-
142
-
143
-
144
-
145
-
146
-
147
-
148
-
149
-
150
-
151
-
152
-
153
-
154
-
155
-
156
-
157
-
158
-
159
-
160
-
161
-
162
-
163
-
164
-
165
-
166
-
167
-
168
-
169
-
170
-
171
-
172
-
173
-
174
-
175
-
176
-
177
-
178
 |
 |

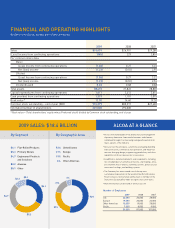
FINANCIAL AND OPERATING HIGHLIGHTS
dollars in millions, except per-share amounts
2009 SALES: $18.4 BILLION
By Segment
$6.1 Flat-Rolled Products
$5.3 Primary Metals
$4.7 Engineered Products
and Solutions
$2.2 Alumina
$0.1 Other
By Geographic Area
52% United States
27% Europe
15% Pacifi c
6% Other Americas
• Alcoa is the world leader in the production and management
of primary aluminum, fabricated aluminum, and alumina
combined, through its active and growing participation in all
major aspects of the industry.
• Alcoa serves the aerospace, automotive, packaging, building
and construction, commercial transportation, and industrial
markets, bringing design, engineering, production, and other
capabilities of Alcoa’s businesses to customers.
• In addition to aluminum products and components, including
fl at-rolled products, hard alloy extrusions, and forgings, Alcoa
also markets Alcoa® wheels, fastening systems, precision and
investment castings, and building systems.
• The Company has been named one of the top most
sustainable corporations in the world at the World Economic
Forum in Davos, Switzerland, and has been a member of the
Dow Jones Sustainability Index for eight consecutive years.
• More information can be found at www.alcoa.com.
Number of Employees
2009 2008 2007
U.S. 23,000 30,000 38,000
Europe 19,000 30,000 32,000
Other Americas 10,000 19,000 28,000
Pacifi c 7,000 8,000 9,000
59,000 87,000 107,000
$6.1
$5.3
$4.7
$2.2 $0.1
52%
27%
15%
6%
ALCOA AT A GLANCE
827,402
2009 2008 2007
Sales $18,439 $26,901 $29,280
(Loss) Income from continuing operations (985) 229 2,814
Per common share data:
Basic:
(Loss) Income from continuing operations (1.06) 0.27 3.24
Net (loss) income (1.23) (0.10) 2.95
Diluted:
(Loss) Income from continuing operations (1.06) 0.27 3.22
Net (loss) income (1.23) (0.10) 2.94
Dividends paid 0.26 0.68 0.68
Total assets 38,472 37,822 38,803
Capital expenditures from continuing operations 1,617 3,413 3,614
Cash provided from continuing operations 1,379 1,101 3,075
Book value * 12.70 14.60 19.30
Common stock outstanding – end of year (000) 974,379 800,317
Estimated number of shareholders 301,000 292,000
* Book value = (Total shareholders’ equity minus Preferred stock) divided by Common stock outstanding, end of year.