Airtran 1999 Annual Report Download - page 20
Download and view the complete annual report
Please find page 20 of the 1999 Airtran annual report below. You can navigate through the pages in the report by either clicking on the pages listed below, or by using the keyword search tool below to find specific information within the annual report.-
 1
1 -
2
-
3
-
4
-
5
-
6
-
7
-
8
-
9
-
 10
10 -
 11
11 -
 12
12 -
 13
13 -
 14
14 -
 15
15 -
 16
16 -
 17
17 -
 18
18 -
 19
19 -
 20
20 -
 21
21 -
 22
22 -
 23
23 -
 24
24 -
 25
25 -
 26
26 -
 27
27 -
 28
28 -
 29
29 -
 30
30 -
31
-
32
-
33
-
34
-
35
-
36
-
37
-
38
-
39
-
40
-
41
-
42
-
43
-
44
-
45
-
46
-
47
-
48
-
49
 |
 |

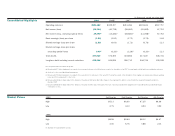
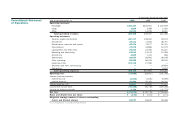
Results of Operations
For the twelve months ended December 31, 1999, 1998 and 1997
The following is a table of selected operational statistics and financial data for the
twelve months ended December 31, 1999, 1998 and 1997:
Twelve Months Ended
December 31,
1999 1998 1997
Revenue passengers 6,460,533 5,462,827 3,005,731
Revenue passenger miles(1) (000’s) 3,473,490 3,244,539 1,597,585
Available seat miles(2) (000’s) 5,467,556 5,442,234 3,017,892
Passenger load factor(3) 63.5% 59.6% 52.9%
Break-even load factor(4) 59.4% 61.5% 76.3%
Average yield per revenue passenger mile(5) 14.01¢ 12.97¢ 12.58¢
Passenger revenue per available seat mile(6) 8.90¢ 7.73¢ 6.66¢
Operating cost per available seat mile(7) 8.19¢ 7.91¢ 9.38¢
Average stage length (miles) 528 546 468
Average cost of aircraft fuel per gallon 49.95¢ 54.87¢ 69.00¢
Average daily utilization(8) (hours) 9:54 9:42 8:25
Number of aircraft in fleet at end of period 47 50 53
(1) The number of scheduled revenue miles flown by passengers.
(2) The number of seats available for passengers multiplied by the number of scheduled miles each seat is flown.
(3) The percentage of aircraft seating capacity that is utilized is calculated by dividing revenue passenger miles by available
seat miles.
(4) Excluding shutdown and other nonrecurring, rebranding and impairment charges, the percentage of seats that must be
occupied by revenue passengers in order for the Company to break even on a pre-tax income basis.
(5) The average amount one passenger pays to fly one mile.
(6) Passenger revenue divided by available seat miles.
(7) Operating expenses, excluding shutdown and other nonrecurring, rebranding and impairment charges, divided by available
seat miles.
(8) The average number of hours per day that an aircraft flown in revenue service is operated.
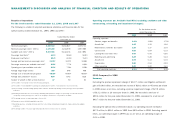
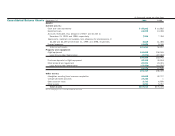
Operating expenses per Available Seat Mile (excluding shutdown and other
nonrecurring, rebranding and impairment charges):
For the twelve months
ended December 31,
1999 1998 1997
Operating expenses:
Salaries, wages and benefits 2.21¢ 1.99¢ 1.79¢
Aircraft fuel 1.25 1.32 1.62
Maintenance, materials and repairs 1.58 1.37 2.03
Commissions 0.68 0.64 0.33
Landing fees and other rents 0.49 0.43 0.60
Marketing and advertising 0.29 0.28 0.44
Aircraft rent 0.09 0.13 0.03
Depreciation 0.52 0.53 0.93
Other operating 1.08 1.22 1.61
Total operating expenses 8.19¢ 7.91¢ 9.38¢
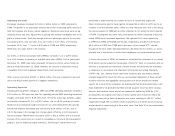
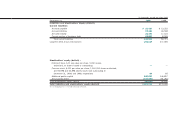
1999 Compared to 1998
Summary
Excluding the pre-tax impairment charge of $147.7 million and litigation settlement
gain of $19.6 million, we recorded net income of $29.1 million or 45 cents per share
in 1999 versus a net loss, excluding a pre-tax impairment charge of $27.5 million,
of $13.2 million or 20 cents per share in 1998. We recorded a net loss of
$99.4 million for the year ended December 31, 1999, compared to a net loss of
$40.7 million for the year ended December 31, 1998.
Excluding the special items mentioned above, our operating income increased
$47.2 million, to $56.1 million in 1999 from $8.9 million in 1998. Excluding special
items, our operating margin in 1999 was 11.1% versus an operating margin of
2.0% in 1998.
MANAGEMENT’S DISCUSSION AND ANALYSIS OF FINANCIAL CONDITION AND RESULTS OF OPERATIONS