Airtel 2015 Annual Report Download - page 11
Download and view the complete annual report
Please find page 11 of the 2015 Airtel annual report below. You can navigate through the pages in the report by either clicking on the pages listed below, or by using the keyword search tool below to find specific information within the annual report.-
 1
1 -
 2
2 -
 3
3 -
 4
4 -
 5
5 -
 6
6 -
 7
7 -
 8
8 -
 9
9 -
 10
10 -
 11
11 -
 12
12 -
 13
13 -
 14
14 -
 15
15 -
 16
16 -
 17
17 -
 18
18 -
 19
19 -
 20
20 -
 21
21 -
 22
22 -
23
-
24
-
25
-
26
-
27
-
28
-
29
-
30
-
31
-
32
-
33
-
34
-
35
-
36
-
37
-
38
-
39
-
40
-
41
-
42
-
43
-
44
-
45
-
46
-
47
-
48
-
49
-
50
-
51
-
52
-
53
-
54
-
55
-
56
-
57
-
58
-
59
-
60
-
61
-
62
-
63
-
64
-
65
-
66
-
67
-
68
-
69
-
70
-
71
-
72
-
73
-
74
-
75
-
76
-
77
-
78
-
79
-
80
-
81
-
82
-
83
-
84
-
85
-
86
-
87
-
88
-
89
-
90
-
91
-
92
-
93
-
94
-
95
-
96
-
97
-
98
-
99
-
100
-
101
-
102
-
103
-
104
-
105
-
106
-
107
-
108
-
109
-
110
-
111
-
112
-
113
-
114
-
115
-
116
-
117
-
118
-
119
-
120
-
121
-
122
-
123
-
124
-
125
-
126
-
127
-
128
-
129
-
130
-
131
-
132
-
133
-
134
-
135
-
136
-
137
-
138
-
139
-
140
-
141
-
142
-
143
-
144
-
145
-
146
-
147
-
148
-
149
-
150
-
151
-
152
-
153
-
154
-
155
-
156
-
157
-
158
-
159
-
160
-
161
-
162
-
163
-
164
-
165
-
166
-
167
-
168
-
169
-
170
-
171
-
172
-
173
-
174
-
175
-
176
-
177
-
178
-
179
-
180
-
181
-
182
-
183
-
184
-
185
-
186
-
187
-
188
-
189
-
190
-
191
-
192
-
193
-
194
-
195
-
196
-
197
-
198
-
199
-
200
-
201
-
202
-
203
-
204
-
205
-
206
-
207
-
208
-
209
-
210
-
211
-
212
-
213
-
214
-
215
-
216
-
217
-
218
-
219
-
220
-
221
-
222
-
223
-
224
-
225
-
226
-
227
-
228
-
229
-
230
-
231
-
232
-
233
-
234
-
235
-
236
-
237
-
238
-
239
-
240
-
241
-
242
-
243
-
244
-
245
-
246
-
247
-
248
-
249
-
250
-
251
-
252
-
253
-
254
-
255
-
256
-
257
-
258
-
259
-
260
-
261
-
262
-
263
-
264
-
265
-
266
-
267
-
268
-
269
-
270
-
271
-
272
-
273
-
274
-
275
-
276
-
277
-
278
-
279
-
280
-
281
-
282
-
283
-
284
-
285
-
286
-
287
-
288
-
289
-
290
-
291
-
292
-
293
-
294
-
295
-
296
-
297
-
298
-
299
-
300
-
301
-
302
-
303
-
304
-
305
-
306
-
307
-
308
-
309
-
310
-
311
-
312
-
313
-
314
-
315
-
316
-
317
-
318
-
319
-
320
-
321
-
322
-
323
-
324
-
325
-
326
-
327
-
328
-
329
-
330
-
331
-
332
-
333
-
334
-
335
-
336
-
337
-
338
-
339
-
340
-
341
-
342
-
343
-
344
-
345
-
346
-
347
-
348
-
349
-
350
-
351
-
352
-
353
-
354
-
355
-
356
-
357
-
358
-
359
-
360
 |
 |

FY 2014-15 FY 2015-16
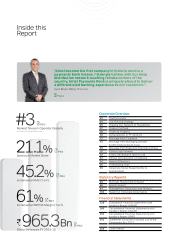
Revenue Market Share
(RMS) in India stood at
31.5% for FY 2015-16
versus 30.7% for
FY 2014-15
Leading the pack on data
revenues with data RMS
of >45% in FY 2015-16
among the top three
India and Africa churn
is under control
Market Share Growth
Revenue
` Mn
5% Y-o-Y
920,394
965,321
EBITDA
` Mn
9% Y-o-Y
314,517
341,902
Incremental
EBITDA Margin
%
361 bps Y-o-Y
57
61
Credible Growth
Opex
Productivity1
%
81 bps Y-o-Y
43.79
42.98
Capex
Productivity2
%
736 bps Y-o-Y
77.40
70.04
Cost Eciency
Expanding Margins
EBITDA Margin
%
125 bps Y-o-Y
34.17
35.42
PAT Margin
%
5 bps Y-o-Y
5.63
5.68
1
81 bps improvement in operational productivity on an year-on-year basis.
This is computed by dividing the operating expenses by the total revenues for
the respective period. Operating expenses is the sum of (i) employee costs,
(ii) network operations costs and (iii) selling, general and administrative costs.
This ratio depicts the operational eciencies in the Company.
2
736 bps decrease in capex productivity on an year-on-year basis.
This is computed by dividing revenue for the period by gross cumulative
capex (gross xed assets and capital work-in-progress) till date i.e. the
physical investments made in the assets creation of the Company. This ratio
depicts the asset productivity of the Company.
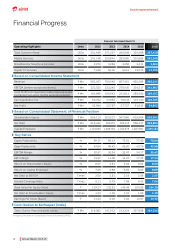
Financial Progress
Bharti Airtel Limited 40-125 | Statutory Reports 126-355 | Financial StatementsCorporate Overview
02-39
9