Airtel 2014 Annual Report Download - page 9
Download and view the complete annual report
Please find page 9 of the 2014 Airtel annual report below. You can navigate through the pages in the report by either clicking on the pages listed below, or by using the keyword search tool below to find specific information within the annual report.-
 1
1 -
 2
2 -
 3
3 -
 4
4 -
 5
5 -
 6
6 -
 7
7 -
 8
8 -
 9
9 -
 10
10 -
 11
11 -
 12
12 -
 13
13 -
 14
14 -
 15
15 -
 16
16 -
 17
17 -
 18
18 -
 19
19 -
 20
20 -
21
-
22
-
23
-
24
-
25
-
26
-
27
-
28
-
29
-
30
-
31
-
32
-
33
-
34
-
35
-
36
-
37
-
38
-
39
-
40
-
41
-
42
-
43
-
44
-
45
-
46
-
47
-
48
-
49
-
50
-
51
-
52
-
53
-
54
-
55
-
56
-
57
-
58
-
59
-
60
-
61
-
62
-
63
-
64
-
65
-
66
-
67
-
68
-
69
-
70
-
71
-
72
-
73
-
74
-
75
-
76
-
77
-
78
-
79
-
80
-
81
-
82
-
83
-
84
-
85
-
86
-
87
-
88
-
89
-
90
-
91
-
92
-
93
-
94
-
95
-
96
-
97
-
98
-
99
-
100
-
101
-
102
-
103
-
104
-
105
-
106
-
107
-
108
-
109
-
110
-
111
-
112
-
113
-
114
-
115
-
116
-
117
-
118
-
119
-
120
-
121
-
122
-
123
-
124
-
125
-
126
-
127
-
128
-
129
-
130
-
131
-
132
-
133
-
134
-
135
-
136
-
137
-
138
-
139
-
140
-
141
-
142
-
143
-
144
-
145
-
146
-
147
-
148
-
149
-
150
-
151
-
152
-
153
-
154
-
155
-
156
-
157
-
158
-
159
-
160
-
161
-
162
-
163
-
164
-
165
-
166
-
167
-
168
-
169
-
170
-
171
-
172
-
173
-
174
-
175
-
176
-
177
-
178
-
179
-
180
-
181
-
182
-
183
-
184
-
185
-
186
-
187
-
188
-
189
-
190
-
191
-
192
-
193
-
194
-
195
-
196
-
197
-
198
-
199
-
200
-
201
-
202
-
203
-
204
-
205
-
206
-
207
-
208
-
209
-
210
-
211
-
212
-
213
-
214
-
215
-
216
-
217
-
218
-
219
-
220
-
221
-
222
-
223
-
224
-
225
-
226
-
227
-
228
-
229
-
230
-
231
-
232
-
233
-
234
-
235
-
236
-
237
-
238
-
239
-
240
-
241
-
242
-
243
-
244
-
245
-
246
-
247
-
248
-
249
-
250
-
251
-
252
-
253
-
254
-
255
-
256
-
257
-
258
-
259
-
260
-
261
-
262
-
263
-
264
-
265
-
266
-
267
-
268
-
269
-
270
-
271
-
272
-
273
-
274
-
275
-
276
-
277
-
278
-
279
-
280
-
281
-
282
-
283
-
284
 |
 |

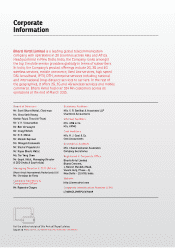
Statutory ReportsCorporate Overview Financial Statements
Bharti Airtel Limited
7
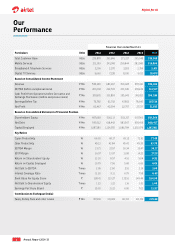
* Churn numbers reported are year-end numbers
1
141 bps improvement in operational productivity
on an year-on-year basis
This is computed by dividing the operating expenses
by the total revenues for the respective period.
Operating expenses is the sum of (i) employee costs
(ii) network operations costs and (iii) selling, general
and administrative costs. This ratio depicts the
operational efficiencies in the Company.
2
449 bps increase in capex productivity on an
year-on-year basis
This is computed by dividing revenue for the period
by gross cumulative capex (gross fixed assets and
capital work in progress) till date i.e. the physical
investments made in the assets creation of the
Company. This ratio depicts the asset productivity
of the Company.
R
Re
ve
n
n
nu
e
M
Ma
a
rket
S
ha
re
(
(
(
RM
S)
)
)
i
in
I
nd
d
i
ia
s
to
o
o
od
at
3
0
.7
%
%
%
for
F
FY
2
0
0
1
4-
15
5
v
er
su
u
s
s
30
.5
5
5
% in
F
FY
2
0
0
1
3-
14
4
L
Le
ad
i
i
n
g
th
h
e
e
pa
c
ck
k
on
d
da
ta
r
re
ve
n
n
nu
es
w
w
w
ith
d
da
a
ta
R
M
MS
,
of
f
f
~45
%
%
%
%
i
in
F
Y
Y
20
14
4
-
-1
5
a
am
m
on
gs
s
t th
e
top
t
th
re
e
e
I
In
di
a
a
a
ch
u
ur
r
n
ma
a
inta
i
in
ed
u
u
u
nd
er
r
r
2
2.
5%
%
%
*,
A
A
f
fr
ic
a
c
ch
ur
n
n
re
du
u
u
ced
t
t
to
o
5
5.
8%
%
%
*
Market Share Growth
Cost Efficiency
Expanding Margins
34.17
32.47
EBITDA Margin
(%)
Credible Growth
920,394
857,461
Revenue
(` Mn)
Y-o
Y-o
-o
o
o
-
-
-Y
Y
Y
Y
7
7
7
7
7
7
%
%
%
%
%
%
%
43.79
45.20
Opex Productivity 1
(%)
PAT Margin
(%)
5.6
3.2
Y-o
Y-o
-o
o
-
-
-Y
Y
Y
Y
1
1
1
1
1
1
7
7
7
7
0
0
0
0
0
0
0
0
b
bp
p
p
p
p
s
s
Y-o
Y-o
o
o
o
-
-Y
-
Y
Y
Y
2
2
2
2
2
2
4
4
4
4
4
0
0
0
0
0
0
0
b
bp
p
p
p
p
p
s
s
Capex Productivity 2
(%)
77.40
72.91
Y-o
-o
o
o
o
-
-
-Y
Y
Y
Y
1
1
1
1
1
1
4
4
4
4
4
1
1
1
1
1
1
1
b
bp
p
p
p
p
s
s
s
Y-o
Y-o
-o
o
o
-
-
-Y
Y
Y
Y
4
4
4
4
4
4
4
4
4
4
4
4
9
9
9
9
9
9
9
9
b
b
bp
p
p
p
p
s
s
s
s
EBITDA
(` Mn)
314,517
278,430
Y-o
Y-o
-o
o
o
-
-
-Y
Y
Y
Y
1
1
1
1
1
1
3
3
3
3
3
%
%
%
%
%
%
%
%
51,835
27,727
PAT
(` Mn)
Y-o
Y-o
-o
o
o
-
-
-Y
Y
Y
Y
8
8
8
8
8
8
7
7
7
7
7
7
%
%
%
%
%
%
%
%
FY 2013-14 FY 2014-15
Our Performance