Air Canada 2009 Annual Report Download - page 2
Download and view the complete annual report
Please find page 2 of the 2009 Air Canada annual report below. You can navigate through the pages in the report by either clicking on the pages listed below, or by using the keyword search tool below to find specific information within the annual report.-
 1
1 -
 2
2 -
 3
3 -
 4
4 -
 5
5 -
 6
6 -
 7
7 -
 8
8 -
 9
9 -
 10
10 -
 11
11 -
 12
12 -
 13
13 -
14
-
15
-
16
-
17
-
18
-
19
-
20
-
21
-
22
-
23
-
24
-
25
-
26
-
27
-
28
-
29
-
30
-
31
-
32
-
33
-
34
-
35
-
36
-
37
-
38
-
39
-
40
-
41
-
42
-
43
-
44
-
45
-
46
-
47
-
48
-
49
-
50
-
51
-
52
-
53
-
54
-
55
-
56
-
57
-
58
-
59
-
60
-
61
-
62
-
63
-
64
-
65
-
66
-
67
-
68
-
69
-
70
-
71
-
72
-
73
-
74
-
75
-
76
-
77
-
78
-
79
-
80
-
81
-
82
-
83
-
84
-
85
-
86
-
87
-
88
-
89
-
90
-
91
-
92
-
93
-
94
-
95
-
96
-
97
-
98
-
99
-
100
-
101
-
102
-
103
-
104
-
105
-
106
-
107
-
108
-
109
-
110
-
111
-
112
-
113
-
114
-
115
-
116
-
117
-
118
-
119
-
120
-
121
-
122
-
123
-
124
-
125
-
126
-
127
-
128
-
129
-
130
-
131
-
132
-
133
-
134
-
135
-
136
-
137
-
138
-
139
-
140
-
141
-
142
-
143
-
144
-
145
-
146
 |
 |

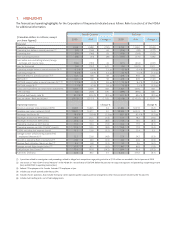
1. HIGHLIGHTS
The fi nancial and operating highlights for the Corporation of the periods indicated are as follows. Refer to section 2 of the MD&A
for additional information.
(Canadian dollars in millions, except
per share fi gures)
Fourth Quarter Full Year
2009 2008 Change $ 2009 2008 (1) Change $
Financial
Operating revenues 2,348 2,498 (150) 9,739 11,082 (1,343)
Operating loss before a special provision (1) (83) (146) 63 (316) (39) (277)
Operating loss (83) (146) 63 (316) (164) (152)
Non-operating expenses (83) (44) (39) (355) (170) (185)
Loss before non-controlling interest, foreign
exchange and income taxes
(166) (190) 24 (671) (334) (337)
Loss for the period (56) (727) 671 (24) (1,025) 1,001
Operating margin before a special provision % (1) -3.5 % -5.8 % 2.3 pp -3.2 % -0.4 % (2.8) pp
Operating margin % -3.5 % -5.8 % 2.3 pp -3.2 % -1.5 % (1.7) pp
EBITDAR before a special provision (1) (2) 167 108 59 679 934 (255)
EBITDAR (2) 167 108 59 679 809 (130)
EBITDAR margin before a special provision % (1) (2) 7.1 % 4.3 % 2.8 pp 7.0 % 8.4 % (1.4) pp
EBITDAR margin % (2) 7.1 % 4.3 % 2.8 pp 7.0 % 7.3 % (0.3) pp
Cash, cash equivalents and short-term investments 1,407 1,005 402 1,407 1,005 402
Free cash fl ow (52) (428) 376 (399) (985) 586
Adjusted debt/equity ratio % 80.1 % 89.6 % (9.5) pp 80.1 % 89.6 % (9.5) pp
Loss per share - Basic and diluted ($0.25) ($7.27) $ 7.02 ($0.18) ($10.25) $ 10.07
Operating Statistics Change % Change %
Revenue passenger miles (millions) (RPM) 10,885 10,845 0.4 47,884 50,519 (5.2)
Available seat miles (millions) (ASM) 13,841 13,571 2.0 59,343 62,074 (4.4)
Passenger load factor % 78.6 % 79.9 % (1.3) pp 80.7 % 81.4 % (0.7) pp
Passenger revenue per RPM (cents) 18.6 20.1 (7.3) 17.7 19.2 (7.6)
Passenger revenue per ASM (cents) 14.6 16.0 (8.8) 14.3 15.6 (8.4)
Operating revenue per ASM (cents) 17.0 18.4 (7.8) 16.4 17.9 (8.1)
Operating expense per ASM ("CASM") (cents) 17.6 19.5 (9.8) 16.9 17.9 (5.4)
CASM, excluding fuel expense (cents) 13.2 13.6 (3.2) 12.8 12.4 3.3
Average number of full-time equivalent (FTE)
employees (thousands)
(3) 22.5 23.6 (4.8) 22.9
24.2 (5.3)
Aircraft in operating fl eet at period end (4) 332 333 (0.3) 332 333 (0.3)
Average fl eet utilization (hours per day) (5) 8.6 8.8 (2.3) 9.2 9.6 (4.2)
Average aircraft fl ight length (miles) (5) 823 827 (0.5) 847 863 (1.9)
Fuel price per litre (cents) (6) 72.6 95.8 (24.2) 69.4 90.4 (23.2)
Fuel litres (millions) 825 822 0.4 3,510 3,763 (6.7)
(1) A provision related to investigations and proceedings related to alleged anti-competitive cargo pricing activities of $125 million was recorded in the fi rst quarter of 2008.
(2) See section 21 “Non-GAAP Financial Measures" in the MD&A for a reconciliation of EBITDAR before the provision for cargo investigations and proceedings to operating income
(loss) and EBITDAR to operating income (loss).
(3) Refl ects FTE employees at Air Canada. Excludes FTE employees at Jazz.
(4) Includes Jazz aircraft covered under the Jazz CPA.
(5) Excludes charter operations. Also excludes third party carriers operating under capacity purchase arrangements, other than Jazz aircraft covered under the Jazz CPA.
(6) Includes fuel handling and is net of fuel hedging results.