Aer Lingus 2010 Annual Report Download - page 3
Download and view the complete annual report
Please find page 3 of the 2010 Aer Lingus annual report below. You can navigate through the pages in the report by either clicking on the pages listed below, or by using the keyword search tool below to find specific information within the annual report.-
 1
1 -
 2
2 -
 3
3 -
 4
4 -
 5
5 -
 6
6 -
 7
7 -
 8
8 -
 9
9 -
 10
10 -
 11
11 -
 12
12 -
 13
13 -
 14
14 -
15
-
16
-
17
-
18
-
19
-
20
-
21
-
22
-
23
-
24
-
25
-
26
-
27
-
28
-
29
-
30
-
31
-
32
-
33
-
34
-
35
-
36
-
37
-
38
-
39
-
40
-
41
-
42
-
43
-
44
-
45
-
46
-
47
-
48
-
49
-
50
-
51
-
52
-
53
-
54
-
55
-
56
-
57
-
58
-
59
-
60
-
61
-
62
-
63
-
64
-
65
-
66
-
67
-
68
-
69
-
70
-
71
-
72
-
73
-
74
-
75
-
76
-
77
-
78
-
79
-
80
-
81
-
82
-
83
-
84
-
85
-
86
-
87
-
88
-
89
-
90
-
91
-
92
-
93
-
94
-
95
-
96
 |
 |

Annual Report 2010
1
Financial highlights Aer Lingus Group Plc
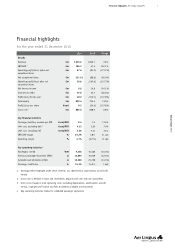
Financial highlights
For the year ended 31 December 2010
2010 2009 Change
Results
Revenue €m 1,215.6 1,205.7 0.8%
EBITDAR 1€m 196.7 57.5 242.1%
Operating profi t/(loss) before net
exceptional items
€m 57.6 (81.0) (171.1%)
Net exceptional items €m (31.0) (88.6) (65.0%)
Operating profi t/(loss) after net
exceptional items
€m 26.6 (169.6) (115.7%)
Net fi nance income €m 6.8 14.8 (54.1%)
Income tax credit €m 15.8 24.7 (36.0%)
Profi t/(loss) for the year €m 49.2 (130.1) (137.8%)
Total equity €m 802.4 704.5 13.9%
Profi t/(loss) per share €cent 9.3 (24.6) (137.8%)
Gross cash 2€m 885.0 828.5 6.8%
Key fi nancial statistics
Passenger/ancillary revenue per RPK €cent/RPK 8.4 7.4 13.5%
Unit cost, excluding fuel 3€cent/RPK 4.12 3.85 7.0%
Unit cost, including fuel €cent/RPK 5.58 5.41 3.1%
EBITDAR margin % 16.2% 4.8% 11.4pt
Operating margin % 4.7% (6.7%) 11.4pt
Key operating statistics 4
Passengers carried ‘000 9,346 10,382 (10.0%)
Revenue passenger kilometres (RPK) m 13,895 15,819 (12.2%)
Available seat kilometres (ASK) m 18,260 21,228 (14.0%)
Passenger load factor % 76.1% 74.5% 1.6pt
1 Earnings before employee profit share, interest, tax, depreciation, amortisation and aircraft
rentals
2 Gross cash is defined as loans and receivables, deposits and cash and cash equivalents
3 Unit cost is based on total operating costs, excluding depreciation, amortisation, aircraft
rentals, employee profit share and fuel, divided by available seat kilometres
4 Key operating statistics related to scheduled passenger operations