Adobe 1999 Annual Report Download - page 21
Download and view the complete annual report
Please find page 21 of the 1999 Adobe annual report below. You can navigate through the pages in the report by either clicking on the pages listed below, or by using the keyword search tool below to find specific information within the annual report.-
 1
1 -
2
-
3
-
4
-
5
-
6
-
7
-
8
-
9
-
10
-
 11
11 -
 12
12 -
 13
13 -
 14
14 -
 15
15 -
 16
16 -
 17
17 -
 18
18 -
 19
19 -
 20
20 -
 21
21 -
 22
22 -
 23
23 -
 24
24 -
 25
25 -
 26
26 -
 27
27 -
 28
28 -
 29
29 -
 30
30 -
 31
31 -
32
-
33
-
34
-
35
-
36
-
37
-
38
-
39
-
40
-
41
-
42
-
43
-
44
-
45
-
46
-
47
-
48
-
49
-
50
-
51
-
52
-
53
-
54
-
55
-
56
-
57
-
58
-
59
-
60
-
61
-
62
-
63
-
64
-
65
-
66
-
67
-
68
-
69
-
70
-
71
-
72
-
73
-
74
-
75
-
76
-
77
-
78
-
79
-
80
-
81
-
82
-
83
-
84
-
85
-
86
-
87
-
88
-
89
-
90
 |
 |

20
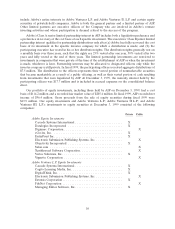
PostScript and Other segment experienced a 9% decline in fiscal 1998 compared to fiscal 1997, due to
weakness in the Japanese personal computer and printer markets, as well as the reduction in royalty
revenue from HP’s desktop monochrome laser printer division.
The decline in revenue in fiscal 1998 was partially offset by an increase in the ePaper Solutions and
Web Publishing segments. The ePaper Solutions segment grew 23% from fiscal 1997, due to increased
demand for Acrobat 3.0. Additionally, the Web Publishing segment increased 14% in fiscal 1998 compared
to fiscal 1997 as a result of the release of our Photoshop 5.0 and Adobe Premiere 5.0 products.
Overall, revenue from our application products on the Windows platform increased 22% in fiscal 1999
compared to fiscal 1998, and revenue from our application products on the Macintosh platform increased
by 21% in fiscal 1999 over fiscal 1998. In fiscal 1998 compared to fiscal 1997, revenue from our application
products on the Windows platform increased by 21% while revenue from our application products on the
Macintosh platform decreased 10% during the same period. In both fiscal 1999 and fiscal 1998, the
Windows and Macintosh platforms accounted for 58% and 42%, respectively, of application products
revenue, excluding platform-independent and UNIX products, compared to 51% and 49%, respectively, in
fiscal 1997. We expect the platform mix to remain relatively the same in the foreseeable future.
Direct costs
1999 Change 1998 Change 1997
Direct costs ...................... $94.5 (6)% $101.0 (13)% $116.2
Percentage of total revenue ........... 9.3% 11.3% 12.7%
We reclassified certain direct costs and operating expenses in the fiscal 1998 and 1997 consolidated
statements of income to conform to the fiscal 1999 presentation. These reclassifications did not impact
total operating profit for fiscal 1998 or 1997.
Direct costs include product packaging, third-party royalties, amortization related to localization costs
and acquired technologies, and reserves for excess and obsolete inventory.
Direct costs decreased $6.5 million, or 6%, in fiscal 1999 compared to fiscal 1998, due to more
effective inventory management, resulting in lower excess and obsolete inventory, as well as lower unit cost
of materials as a result of our ongoing cost improvement program.
Direct costs decreased $15.2 million, or 13%, in fiscal 1998 compared to fiscal 1997, due to lower
packaging costs and our full transition from distribution of our products on disk to CD-ROM media.
Direct costs also decreased in fiscal 1998 compared to fiscal 1997 as certain acquired technologies became
fully amortized and we incurred lower product localization costs.
As a result of the impact of ongoing cost improvement programs, we have targeted gross margin to be
approximately 91% throughout fiscal 2000.
Operating expenses
We reclassified certain direct costs and operating expenses in the fiscal 1998 and 1997 consolidated
statements of income to conform to the fiscal 1999 presentation. These reclassifications did not impact
total operating profit for fiscal 1998 or 1997.
Research and development
1999 Change 1998 Change 1997
Research and development .......... $197.5 5% $188.3 14% $165.9
Percentage of total revenue .......... 19.4% 21.0% 18.2%