Adobe 1999 Annual Report Download - page 18
Download and view the complete annual report
Please find page 18 of the 1999 Adobe annual report below. You can navigate through the pages in the report by either clicking on the pages listed below, or by using the keyword search tool below to find specific information within the annual report.-
 1
1 -
2
-
3
-
4
-
5
-
6
-
7
-
 8
8 -
 9
9 -
 10
10 -
 11
11 -
 12
12 -
 13
13 -
 14
14 -
 15
15 -
 16
16 -
 17
17 -
 18
18 -
 19
19 -
 20
20 -
 21
21 -
 22
22 -
 23
23 -
 24
24 -
 25
25 -
 26
26 -
 27
27 -
 28
28 -
29
-
30
-
31
-
32
-
33
-
34
-
35
-
36
-
37
-
38
-
39
-
40
-
41
-
42
-
43
-
44
-
45
-
46
-
47
-
48
-
49
-
50
-
51
-
52
-
53
-
54
-
55
-
56
-
57
-
58
-
59
-
60
-
61
-
62
-
63
-
64
-
65
-
66
-
67
-
68
-
69
-
70
-
71
-
72
-
73
-
74
-
75
-
76
-
77
-
78
-
79
-
80
-
81
-
82
-
83
-
84
-
85
-
86
-
87
-
88
-
89
-
90
 |
 |

17
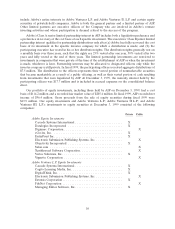
Item 6. Selected Financial Data
The following selected consolidated financial data (presented in thousands, except per share amounts and
employee data) are derived from the Company’s consolidated financial statements. This data should be read in
conjunction with the consolidated financial statements and notes thereto, and with Item 7, Management’s
Discussion and Analysis of Financial Condition and Results of Operations.
Years Ended
Dec. 3 Nov. 27 Nov. 28 Nov. 29 Dec. 1
1999 1998 1997 1996 1995
Operations:
Revenue ........................ $1,015,434 $894,791 $911,894 $ 786,563 $762,339
Income before income taxes .......... 374,427 167,694 296,090 244,824 163,853
Net income(1) .................... 237,751 105,144 186,837 153,277 93,485
Net income per share(1)
Basic ......................... 1.97 0.79 1.30 1.06 0.66
Diluted ....................... 1.84 0.77 1.26 1.02 0.63
Cash dividends declared per
common share(2) ................ 0.10 0.10 0.10 0.10 0.10
Financial position:
Cash and short-term investments ...... 498,716 272,547 502,956 564,116 516,040
Working capital ................... 355,386 204,979 454,299 506,092 506,472
Total assets ...................... 803,859 767,331 940,071 1,001,393 872,827
Stockholders’ equity ................ 512,209 516,365 715,424 706,514 698,417
Additional data:
Worldwide employees ............... 2,745 2,664 2,654 2,222 2,322
All share and per share amounts referred to in the above table have been adjusted to reflect the two-
for-one stock split in the form of a stock dividend effected October 26, 1999.
(1) In 1999, includes investment gains of $88.9 million, restructuring and other charges of $23.0 million, and
acquired in-process research and development of $3.6 million. In 1998, includes investment gains of
$15.0 million and restructuring and other charges of $38.2 million. In 1997, includes investment gains of
$34.3 million, other nonrecurring gains of $0.6 million, and acquired in-process research and develop-
ment of $6.0 million. In 1996, includes investment gains of $68.9 million, acquired in-process research
and development of $21.3 million, and restructuring charges related to divested products of $5.0 million.
In 1995, reflects restructuring charges of $31.5 million related to the acquisition of Frame Technology
Corporation (‘‘Frame’’) and acquired in-process research and development of $15.0 million.
(2) Dividends prior to the acquisition of Frame on October 28, 1995 have not been restated to reflect the
effects of the poolings of interest.