Activision 2012 Annual Report Download - page 6
Download and view the complete annual report
Please find page 6 of the 2012 Activision annual report below. You can navigate through the pages in the report by either clicking on the pages listed below, or by using the keyword search tool below to find specific information within the annual report.-
 1
1 -
 2
2 -
 3
3 -
 4
4 -
 5
5 -
 6
6 -
 7
7 -
 8
8 -
 9
9 -
 10
10 -
 11
11 -
 12
12 -
 13
13 -
 14
14 -
 15
15 -
 16
16 -
 17
17 -
18
-
19
-
20
-
21
-
22
-
23
-
24
-
25
-
26
-
27
-
28
-
29
-
30
-
31
-
32
-
33
-
34
-
35
-
36
-
37
-
38
-
39
-
40
-
41
-
42
-
43
-
44
-
45
-
46
-
47
-
48
-
49
-
50
-
51
-
52
-
53
-
54
-
55
-
56
-
57
-
58
-
59
-
60
-
61
-
62
-
63
-
64
-
65
-
66
-
67
-
68
-
69
-
70
-
71
-
72
-
73
-
74
-
75
-
76
-
77
-
78
-
79
-
80
-
81
-
82
-
83
-
84
-
85
-
86
-
87
-
88
-
89
-
90
-
91
-
92
-
93
-
94
-
95
-
96
-
97
-
98
-
99
-
100
 |
 |

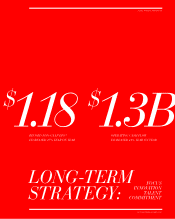
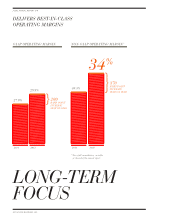
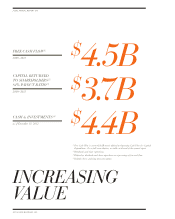
LONG-TERM
FOCUS
DELIVERS BEST-IN-CLASS
OPERATING MARGINS
GAAP OPERATING MARGIN NON-GAAP OPERATING MARGIN(1)
(1)
For a full reconciliation, see tables
at the end of the annual report.
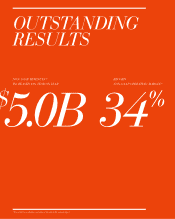
30.3%
34%
2011 2012
27.9%
29.9%
2011 2012
370
BASIS POINT
INCREASE
YEAR ON YEAR
200
BASIS POINT
INCREASE
YEAR ON YEAR
ACTIVISION BLIZZARD, INC.
/ 2012 ANNUAL REPORT / 4