Activision 2012 Annual Report Download - page 19
Download and view the complete annual report
Please find page 19 of the 2012 Activision annual report below. You can navigate through the pages in the report by either clicking on the pages listed below, or by using the keyword search tool below to find specific information within the annual report.-
 1
1 -
2
-
3
-
4
-
5
-
6
-
7
-
8
-
 9
9 -
 10
10 -
 11
11 -
 12
12 -
 13
13 -
 14
14 -
 15
15 -
 16
16 -
 17
17 -
 18
18 -
 19
19 -
 20
20 -
 21
21 -
 22
22 -
 23
23 -
 24
24 -
 25
25 -
 26
26 -
 27
27 -
 28
28 -
 29
29 -
30
-
31
-
32
-
33
-
34
-
35
-
36
-
37
-
38
-
39
-
40
-
41
-
42
-
43
-
44
-
45
-
46
-
47
-
48
-
49
-
50
-
51
-
52
-
53
-
54
-
55
-
56
-
57
-
58
-
59
-
60
-
61
-
62
-
63
-
64
-
65
-
66
-
67
-
68
-
69
-
70
-
71
-
72
-
73
-
74
-
75
-
76
-
77
-
78
-
79
-
80
-
81
-
82
-
83
-
84
-
85
-
86
-
87
-
88
-
89
-
90
-
91
-
92
-
93
-
94
-
95
-
96
-
97
-
98
-
99
-
100
 |
 |

1
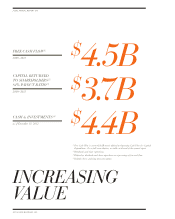
SELECTED FINANCIAL DATA
For accounting purposes, the Business Combination (as defined below) was treated as a “reverse acquisition,” with Vivendi Games (as
defined below) deemed to be the acquirer. The historical financial statements of Activision Blizzard, Inc. prior to July 9, 2008 are those of
Vivendi Games (see Note 1 of the Notes to Consolidated Financial Statements included in this Annual Report). Therefore, 2012, 2011, 2010,
2009 and 2008 financial data is not comparable with prior periods.
The terms “Activision Blizzard,” the “Company,” “we,” “us,” and “our” are used to refer collectively to Activision Blizzard, Inc. and
its subsidiaries.
The following table summarizes certain selected consolidated financial data, which should be read in conjunction with our
Consolidated Financial Statements and Notes thereto and with Management’s Discussion and Analysis of Financial Condition and Results of
Operations included elsewhere in this Annual Report. The selected consolidated financial data presented below at and for each of the years in the
five-year period ended December 31, 2012 is derived from our Consolidated Financial Statements. All amounts set forth in the following tables
are in millions, except per share data.
For the Years Ended December 31,
2012
2011
2010
2009
2008
Statement of Operations Data:
Net Revenues .........................................................................................................................
$4,856
$4,755
$4,447
$4,279
$3,026
Net income (loss) ..................................................................................................................
1,149
1,085
418(1)
113(2)
(107)
Basic net income (loss) per share(3) .......................................................................................
1.01
0.93
0.34
0.09
(0.11)
Diluted net income (loss) per share(3) ...................................................................................
1.01
0.92
0.33
0.09
(0.11)
Cash dividends declared per share(4) .....................................................................................
0.18
0.165
0.15
—
—
Balance Sheet Data:
Total assets ............................................................................................................................
$14,200
$13,277
$13,447
$13,742
$14,465
(1) In the fourth quarter of 2010, we recorded $326 million of impairment charges within our Activision segment. These charges
consisted of impairments of $67 million, $9 million and $250 million to license agreements, game engines and internally developed
franchises intangible assets, respectively.
(2) In the fourth quarter of 2009, we recorded $409 million of impairment charges within our Activision segment. These charges
consisted of impairments of $24 million, $12 million and $373 million to license agreements, game engines and internally developed
franchise intangible assets, respectively.
(3) Stock Split—In July 2008, the Board of Directors declared a two-for-one split of our outstanding shares of common stock effected in
the form of a stock dividend. The stock dividend was issued on September 5, 2008 to shareholders of record at the close of business on
August 25, 2008.
(4) Cash Dividends—On February 9, 2012, our Board of Directors declared a cash dividend of $0.18 per share payable on May 16, 2012
to shareholders of record at the close of business on March 21, 2012. On February 9, 2011, our Board of Directors declared a cash
dividend of $0.165 per share to be paid on May 11, 2011 to shareholders of record at the close of business on March 16, 2011. On
February 10, 2010, our Board of Directors declared a cash dividend of $0.15 per common share payable on April 2, 2010 to
shareholders of record at the close of business on February 22, 2010. Future dividends will depend upon our earnings, financial
condition, cash requirements, future prospects and other factors deemed relevant by our Board of Directors. There can be no
assurances that dividends will be declared in the future. Prior to the cash dividend declared in February 2010, the Company had never
paid a cash dividend.