Access America 2004 Annual Report Download - page 38
Download and view the complete annual report
Please find page 38 of the 2004 Access America annual report below. You can navigate through the pages in the report by either clicking on the pages listed below, or by using the keyword search tool below to find specific information within the annual report.-
 1
1 -
2
-
3
-
4
-
5
-
6
-
7
-
8
-
9
-
10
-
11
-
12
-
13
-
14
-
15
-
16
-
17
-
18
-
19
-
20
-
21
-
22
-
23
-
24
-
25
-
26
-
27
-
 28
28 -
 29
29 -
 30
30 -
 31
31 -
 32
32 -
 33
33 -
 34
34 -
 35
35 -
 36
36 -
 37
37 -
 38
38 -
 39
39 -
 40
40
 |
 |

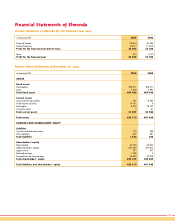
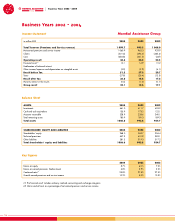
Business Years 2002 - 2004
36
Income Statement Mondial Assistance Group
in million EUR 2004 2003 2002
Total Turnover (Premiums and Service revenue) 1 099.7 995.5 1 008.0
Net earned premiums and service income 1 060.9 962.3 933.9
Claims (531.6) (496.6) (463.4)
Costs (484.8) (441.5) (447)
Operating result 44.6 24.2 23.5
Financial result (1) 10.1 16.9 10.2
Reallocation of technical interest
Other income/expenses and depreciation on intangible assets (3.2) (3.9) (4.1)
Result before Tax 51.5 37.2 29.7
Taxes (27.8) (20.4) (12.5)
Result after Tax 23.6 16.8 17.2
Minority interest in the results (0.5) (1.2) (0.1)
Group result 23.1 15.6 17.1
Balance Sheet
ASSETS 2004 2003 2002
Investments 461.0 411.7 403.2
Cash and cash equivalents 135.9 173.2 122.1
Accounts receivable 228.9 228.6 240.1
Total remaining assets 180.9 180.3 189.3
Total assets 1006.6 993.8 954.7
SHAREHOLDERS’ EQUITY AND LIABILITIES 2004 2003 2002
Shareholders’ equity 268.0 263.7 254.4
Technical provisions 457.3 410.9 383.1
Other liabilities 281.3 319.3 317.2
Total shareholders’ equity and liabilities 1006.6 993.8 954.7
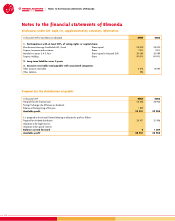
Key Figures
2004 2003 2002
Return on equity 8.7% 6.0% 7.2%
Return on earned premiums (before taxes) 4.8% 3.9% 3.2%
Combined ratio (2) 95.8% 97.5% 97.5%
Growth earned premiums and service income 10.2% 3.0% 10.3%
(1) The financial result includes ordinary, realised, accounting and exchange rate gains.
(2) Claims and all costs as a percentage of net earned premiums and service income.
Business Years 2002 - 2004