Aarons 2012 Annual Report Download - page 3
Download and view the complete annual report
Please find page 3 of the 2012 Aarons annual report below. You can navigate through the pages in the report by either clicking on the pages listed below, or by using the keyword search tool below to find specific information within the annual report.-
 1
1 -
 2
2 -
 3
3 -
 4
4 -
 5
5 -
 6
6 -
 7
7 -
 8
8 -
 9
9 -
 10
10 -
 11
11 -
 12
12 -
 13
13 -
 14
14 -
15
-
16
-
17
-
18
-
19
-
20
-
21
-
22
-
23
-
24
-
25
-
26
-
27
-
28
-
29
-
30
-
31
-
32
-
33
-
34
-
35
-
36
-
37
-
38
-
39
-
40
-
41
-
42
-
43
-
44
-
45
-
46
-
47
-
48
-
49
-
50
-
51
-
52
-
53
-
54
-
55
-
56
-
57
-
58
-
59
-
60
-
61
-
62
-
63
-
64
-
65
-
66
-
67
-
68
-
69
-
70
-
71
-
72
-
73
-
74
-
75
-
76
-
77
-
78
-
79
-
80
-
81
-
82
-
83
-
84
-
85
-
86
-
87
-
88
-
89
-
90
-
91
-
92
-
93
-
94
-
95
 |
 |

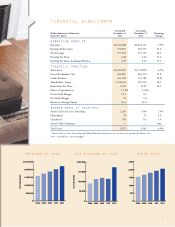
0
150,000
$200,000
50,000
100,000
20122011201020092008
0
500,000
1,000,000
2,000,000
$2,500,000
1,500,000
20122011201020092008
Revenues By Year Net Earnings By Year
($ in thousands)
($ in thousands)
0
500
2,000
2,500
1,000
1,500
20122011201020092008
Store Count
* Aaron’s Sales & Lease Ownership and HomeSmart franchised stores are not owned or operated by Aaron’s, Inc.
NMF — calculation is not meaningful
Year Ended Year Ended
(Dollar Amounts in Thousands, December 31, December 31, Percentage
Except Per Share) 2012 2011 Change
OPERATING RESULTS
Revenues $2,222,588 $2,022,331 9.9%
Earnings Before Taxes 276,855 183,377 51.0
Net Earnings 173,043 113,767 52.1
Earnings Per Share 2.28 1.46 56.2
Earnings Per Share Assuming Dilution 2.25 1.43 57.3
FINANCIAL POSITION
Total Assets $1,812,929 $1,731,899 4.7%
Lease Merchandise, Net 964,067 862,276 11.8
Credit Facilities 141,528 153,789 (8.0)
Shareholders’ Equity 1,136,126 976,554 16.3
Book Value Per Share 15.00 12.91 16.2
Debt to Capitalization 11.1% 13.6%
Pretax Profit Margin 12.5 9.1
Net Profit Margin 7.8 5.6
Return on Average Equity 16.4 11.6
STORES OPEN AT YEAR-END
Aaron’s Sales & Lease Ownership 1,246 1,160 7.4%
HomeSmart 78 71 9.9
Franchised* 749 713 5.0
Aaron’s Office Furniture — 1 nmf
Total Stores 2,073 1,945 6.6%
FINANCIAL HIGHLIGHTS
1