Aarons 2008 Annual Report Download - page 16
Download and view the complete annual report
Please find page 16 of the 2008 Aarons annual report below. You can navigate through the pages in the report by either clicking on the pages listed below, or by using the keyword search tool below to find specific information within the annual report.
Selected Financial Information
Year Ended Year Ended Year Ended Year Ended Year Ended
(Dollar Amounts in Thousands, December 31, December 31, December 31, December 31, December 31,
Except Per Share) 2008 2007 2006 2005 2004
Operating Results
Revenues:
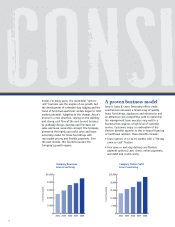
Rentals and Fees $1,178,719 $1,045,804 $ 915,872 $ 772,894 $ 628,435
Retail Sales 43,187 34,591 40,102 36,758 34,745
Non-Retail Sales 309,326 261,584 224,489 185,622 160,774
Franchise Royalties and Fees 45,025 38,803 33,626 29,781 25,093
Other 16,351 14,157 14,358 7,248 10,742
1,592,608 1,394,939 1,228,447 1,032,303 859,789
Costs and Expenses:
Retail Cost of Sales 26,379 21,201 25,207 23,236 23,149
Non-Retail Cost of Sales 283,358 239,755 207,217 172,807 149,207
Operating Expenses 705,566 617,106 525,980 454,548 366,293
Depreciation of Rental Merchandise 429,907 391,538 349,218 292,091 240,676
Interest 7,818 7,587 8,567 7,376 4,558
1,453,028 1,277,187 1,116,189 950,058 783,883
Earnings From Continuing Operations
Before Income Taxes 139,580 117,752 112,258 82,245 75,906
Income Taxes 53,811 44,327 41,355 30,530 28,624
Net Earnings From Continuing Operations 85,769 73,425 70,903 51,715 47,282
Earnings From Discontinued Operations,
Net of Tax 4,420 6,850 7,732 6,278 5,334
Net Earnings $ 90,189 $ 80,275 $ 78,635 $ 57,993 $ 52,616
Earnings Per Share From Continuing Operations $ 1.61 $ 1.35 $ 1.35 $ 1.03 $ .95
Earnings Per Share From Continuing Operations
Assuming Dilution 1.58 1.33 1.33 1.02 .93
Earnings Per Share From Discontinued Operations .08 .13 .15 .13 .11
Earnings Per Share From Discontinued Operations
Assuming Dilution .08 .13 .14 .12 .11
Dividends Per Share:
Common $ .065 $ .061 $ .057 $ .054 $ .039
Class A .065 .061 .057 .054 .039
Financial position
Rental Merchandise, Net $ 681,086 $ 558,322 $ 550,205 $ 486,797 $ 371,095
Property, Plant and Equipment, Net 224,431 243,447 167,323 131,612 109,457
Total Assets 1,233,270 1,113,176 979,606 858,515 700,288
Interest-Bearing Debt 114,817 185,832 129,974 211,873 116,655
Shareholders’ Equity 761,544 673,380 607,015 434,471 375,178
At Year End
Stores Open:
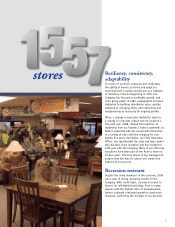
Company-Operated 1,053 1,030 857 760 628
Franchised 504 484 441 392 357
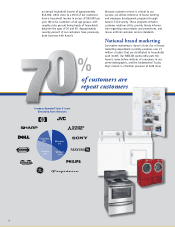
Rental Agreements in Effect 1,017,000 820,000 734,000 654,000 535,000
Number of Employees 9,600 9,100 7,900 7,100 5,900
14


