Aarons 2003 Annual Report Download - page 9
Download and view the complete annual report
Please find page 9 of the 2003 Aarons annual report below. You can navigate through the pages in the report by either clicking on the pages listed below, or by using the keyword search tool below to find specific information within the annual report.-
 1
1 -
 2
2 -
 3
3 -
 4
4 -
 5
5 -
 6
6 -
 7
7 -
 8
8 -
 9
9 -
 10
10 -
 11
11 -
 12
12 -
 13
13 -
 14
14 -
 15
15 -
 16
16 -
 17
17 -
 18
18 -
 19
19 -
 20
20 -
21
-
22
-
23
-
24
-
25
-
26
-
27
-
28
-
29
-
30
-
31
-
32
-
33
-
34
-
35
-
36
-
37
-
38
-
39
-
40
 |
 |

7
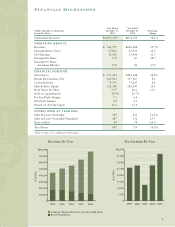
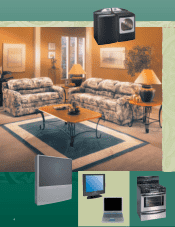
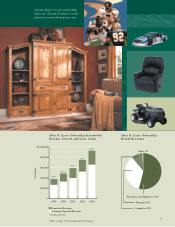
Sales & Lease Ownership
Rental Revenues
Electronics and Appliances 54%
Furniture 35%
Computers 10%
Other 1%
Sales & Lease Ownership Systemwide1
Revenue Growth and Store Count
Aaron’s Sales & Lease Ownership
offers its “Dream Products” on the
Internet at www.shopaarons.com.
0
200,000
400,000
600,000
800,000
$1,000,000
1999 2000 2001 2002 2003
$176 $177 $152 $122 $110
368*
456*
573*
644*
787*
Franchisee Revenues
Company-Operated Revenues
($ in 000s)
* Number of Stores
1Refer to page 15 for additional information.