Aarons 1997 Annual Report Download - page 9
Download and view the complete annual report
Please find page 9 of the 1997 Aarons annual report below. You can navigate through the pages in the report by either clicking on the pages listed below, or by using the keyword search tool below to find specific information within the annual report.-
 1
1 -
 2
2 -
 3
3 -
 4
4 -
 5
5 -
 6
6 -
 7
7 -
 8
8 -
 9
9 -
 10
10 -
 11
11 -
 12
12 -
 13
13 -
 14
14
 |
 |

Revenues from retail sales increased $5.6 million (11.8%) to
$52.8 million in 1996, from $47.2 million for the same peri-
od last year. This increase was due to increased sales of both
new and rental return furniture in the rent-to-rent division.
Non-retail sales, which primarily represent merchandise sold
to Aaron’s Rental Purchase franchisees, increased $3.0 mil-
lion (51.0%) to $8.8 million compared to $5.8 million for
the same period last year. The increased sales are due to the
growth of the franchise operations.
Other revenues increased $1.5 million (105.4%) to $2.9 mil-
lion compared to $1.4 million last year. This increase was due
to adding 25 new franchise stores in 1996 as well as older
franchise stores gaining in revenues.
Cost of sales from retail sales increased $4.8 million (14.5%)
to $37.8 million compared to $33.1 million, and as a per-
centage of sales, increased slightly to 71.7% from 70.1%
primarily due to product mix. Cost of sales from non-retail
sales increased $3.1 million (59.5%) to $8.3 million from
$5.2 million, and as a percentage of sales, increased to 94.9%
from 89.8%. The increase in cost of sales as a percentage of
sales is due to a larger percentage of franchise sales in
1996, which are at lower margins than other miscellaneous
wholesale sales.
Operating expenses increased $15.4 million (12.9%) to
$135.0 million from $119.6 million. As a percentage of total
revenues, operating expenses were 49.2% in 1996 and 50.3%
in 1995. Operating expenses declined as a percentage of total
revenues between years due to the spreading of expenses
over higher revenues.
Depreciation of rental merchandise increased $9.0 million
(16.3%) to $64.4 million and, as a percentage of total rentals
and fees, increased to 30.9% from 30.4%. This increase is pri-
marily due to a change in the rental merchandise mix during
the year.
Interest expense increased $277,000 (8.7%) to $3.4 million
compared to $3.2 million. As a percentage of total revenues,
interest is unchanged at 1.3% due to stability in interest rates
during 1996.
Income tax expense increased $1.7 million (20.6%) to $9.8
million compared to $8.1 million. The Company’s effective
tax rate was 38.9% in 1996 versus 38.0% for the same peri-
od in 1995.
As a result, net earnings increased $2.2 million (16.5%) to
$15.4 million for 1996 compared to $13.2 million for the
same period in 1995. As a percentage of total revenues, net
earnings were 5.6% in both 1996 and 1995.
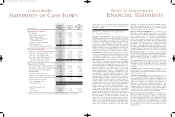
Liquidity and Capital Resources
Cash flows from operations for the years ended December
31, 1997 and 1996 was $105.3 million and $89.5 million,
respectively. Such cash flows include profits on the sale of
rental return merchandise. The Company’s primary capital
requirements consist of acquiring rental merchandise for
both rent-to-rent and Company-operated Aaron’s Rental
Purchase stores. As the Company continues to grow, the need
for additional rental merchandise will continue to be the
Company’s major capital requirement. These capital require-
ments historically have been financed through bank credit,
cash flow from operations, trade credit and proceeds from
the sale of rental return merchandise.
The Company has financed its growth through a revolving
credit agreement with several banks, trade credit and inter-
nally generated funds. The revolving credit agreement provides
for unsecured borrowings up to $90.0 million which includes
a $6.0 million credit line to fund daily working capital
requirements. At December 31, 1997, an aggregate of $75.9
million was outstanding under this facility, bearing interest at
an average fixed rate of 6.57%. The Company uses interest
rate swap agreements as part of its overall long-term financing
program. At December 31, 1997, the Company had swap
agreements with notional principal amounts of $40.0 million
which effectively fixed the interest rates on an equal amount
of the Company’s revolving credit agreement at 6.93%.
The Company believes that the expected cash flows from
operations, proceeds from the sale of rental return merchan-
dise, bank borrowings and vendor credit, together with the
proceeds of a proposed stock offering (see N ote M in the
N otes to Consolidated Financial Statements), will be sufficient
to fund the Company’s capital and liquidity needs for at least
the next 24 months.
In February 1997, the Company’s Board of Directors autho-
rized the repurchase of up to 1,000,000 shares of the
Company’s Common Stock and Class A Common Stock.
During 1997, 795,000 shares were purchased at an aggregate
cost of $8.9 million.
The Company has paid dividends for eleven consecutive years.
A $.02 per share dividend on Common Stock and on ClassA
Common Stock was paid in January 1997 and July 1997, for a
total fiscal year cash outlay of $761,000. The Company cur-
rently expects to continue its policy of paying dividends.
Year 2000
The Year 2000 issue arises from the widespread use of com-
puter programs that rely on two-digit date codes to perform
computations or decision-making functions. The Company’s
significant computer programs, including financial, account-
ing, store operating and point-of-sale software, have recently
been or are in the process of being updated. The upgrading
and rewriting of the Company’s software is being done to
gain further strategic advantages over competitors and is not
the result of any anticipated Year 2000 issues. However, as
part of the Company’s continuing process to update systems,
management has required that vendor-purchased and inter-
nally developed software be Year 2000 compliant. Therefore,
based on recent and continuing strategic enhancement of the
Company’s software, management does not expect any
material impact to the Company’s business, operations or
financial condition as a result of Year 2000 issues.
15
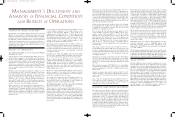
Management’s Discussion and
Analysis of Financial Condition
and Results of Operations
Change in Fiscal Year End
During 1995, the Company changed its fiscal year end from
March 31 to December 31, which resulted in a nine-month
fiscal year ended December 31, 1995. The decision to change
the fiscal year end was made for more convenience in both
internal and external communications. To aid comparative
analysis, the Company has elected to present the results of
operations for the twelve months ended December 31, 1995
(unaudited), along with the years ended December 31, 1997
and December 31, 1996.
Results of Operations
Year Ended December 31, 1997 versus Year Ended
December 31, 1996
Total revenues for 1997 increased $36.5 million (13.3%) to
$310.8 million compared to $274.2 million in 1996 due pri-
marily to a $22.7 million (10.9%) increase in rentals and fees
revenues, plus an $11.7 million (19.0%) increase in sales. Of
this increase in rentals and fees revenues, $19.2 million
(84.4%) was attributable to the Aaron’s Rental Purchase
division. Rentals and fees revenues from the Company’s rent-
to-rent operations increased $3.5 million (3.3%) during the
same period.
Revenues from retail sales increased $5.8 million (11.1%)
to $58.6 million in 1997, from $52.8 million for the same
period last year. This increase was due to increased sales of
both new and rental return furniture in the rent-to-rent
division. Non-retail sales, which primarily represent mer-
chandise sold to Aaron’s Rental Purchase franchisees,
increased $5.9 million (66.7%) to $14.6 million compared to
$8.8 million for the same period last year. The increased sales
are due to the growth of the franchise operations.
Other revenues for 1997 increased $2.1 million (48.6%) to
$6.3 million compared to $4.3 million in 1996. This increase
was attributable to franchise fee and royalty income increas-
ing $2.1 million (70.8%) to $5.0 million compared to $2.9
million last year, reflecting the addition of 40 new franchise
stores in 1997 and improved operating revenues at mature
franchise stores.
Cost of sales from retail sales increased $4.4 million (11.7%)
to $42.3 million compared to $37.8 million, and as a per-
centage of sales, increased slightly to 72.1% from 71.7%
primarily due to product mix. Cost of sales from non-retail
sales increased $5.3 million (64.1%) to $13.7 million from
$8.3 million, and as a percentage of sales, decreased to 93.4%
from 94.9%. The decrease in 1997 in cost of sales as a per-
centage of sales is due to slightly higher margins on sales
through the Company’s distribution centers.
Operating expenses increased $14.7 million (10.9%) to
$149.7 million from $135.0 million. As a percentage of total
revenues, operating expenses were 48.2% in 1997 and 49.2%
in 1996. Operating expenses declined as a percentage of total
revenues between years due to the spreading of expenses
over higher revenues.
Depreciation of rental merchandise increased $6.7 million
(10.4%) to $71.2 million, from $64.4 million, and as a percent-
age of total rentals and fees, decreased to 30.8% from 30.9%.
Interest expense increased $272,000 (7.9%) to $3.7 million
compared to $3.4 million. As a percentage of total revenues,
interest expense was 1.2% in 1997 compared to 1.3% in
1996. The slight decrease in interest expense as a percentage
of revenues was due to the effect of lower debt levels as a
percentage of revenues throughout the year being offset by
slightly higher interest rates.
Income tax expense increased $2.1 million (21.0%) to $11.8
million compared to $9.8 million. The Company’s effective
tax rate was 39.2% in 1997 compared to 38.9% in 1996, pri-
marily due to higher state income taxes.
As a result, net earnings increased $3.0 million (19.5%) to
$18.4 million for 1997 compared to $15.4 million for the
same period in 1996. As a percentage of total revenues, net
earnings were 5.9% in 1997 and 5.6% in 1996.
Year Ended December 31, 1996 verses Twelve Months
Ended December 31, 1995 (unaudited)
Total revenues for 1996 increased $36.5 million (15.3%) to
$274.2 million compared to $237.8 million in 1995 due pri-
marily to a $26.2 million (14.3%) increase in rentals and fees
revenues, plus an $8.5 million (16.1%) increase in sales. Of
this increase in rentals and fees revenues, $16.6 million
(19.6%) was attributable to the Aaron’s Rental Purchase
division. Rentals and fees revenues from the Company’s rent-
to-rent operations increased $9.5 million (9.8%) during the
same period.
14
AR layout Final.wpc 4/24/98 8:24 AM Page 17