AIG 2012 Annual Report Download - page 7
Download and view the complete annual report
Please find page 7 of the 2012 AIG annual report below. You can navigate through the pages in the report by either clicking on the pages listed below, or by using the keyword search tool below to find specific information within the annual report.-
 1
1 -
 2
2 -
 3
3 -
 4
4 -
 5
5 -
 6
6 -
 7
7 -
 8
8 -
 9
9 -
 10
10 -
 11
11 -
 12
12 -
 13
13 -
 14
14 -
 15
15 -
 16
16 -
 17
17 -
 18
18 -
19
-
20
-
21
-
22
-
23
-
24
-
25
-
26
-
27
-
28
-
29
-
30
-
31
-
32
-
33
-
34
-
35
-
36
-
37
-
38
-
39
-
40
-
41
-
42
-
43
-
44
-
45
-
46
-
47
-
48
-
49
-
50
-
51
-
52
-
53
-
54
-
55
-
56
-
57
-
58
-
59
-
60
-
61
-
62
-
63
-
64
-
65
-
66
-
67
-
68
-
69
-
70
-
71
-
72
-
73
-
74
-
75
-
76
-
77
-
78
-
79
-
80
-
81
-
82
-
83
-
84
-
85
-
86
-
87
-
88
-
89
-
90
-
91
-
92
-
93
-
94
-
95
-
96
-
97
-
98
-
99
-
100
-
101
-
102
-
103
-
104
-
105
-
106
-
107
-
108
-
109
-
110
-
111
-
112
-
113
-
114
-
115
-
116
-
117
-
118
-
119
-
120
-
121
-
122
-
123
-
124
-
125
-
126
-
127
-
128
-
129
-
130
-
131
-
132
-
133
-
134
-
135
-
136
-
137
-
138
-
139
-
140
-
141
-
142
-
143
-
144
-
145
-
146
-
147
-
148
-
149
-
150
-
151
-
152
-
153
-
154
-
155
-
156
-
157
-
158
-
159
-
160
-
161
-
162
-
163
-
164
-
165
-
166
-
167
-
168
-
169
-
170
-
171
-
172
-
173
-
174
-
175
-
176
-
177
-
178
-
179
-
180
-
181
-
182
-
183
-
184
-
185
-
186
-
187
-
188
-
189
-
190
-
191
-
192
-
193
-
194
-
195
-
196
-
197
-
198
-
199
-
200
-
201
-
202
-
203
-
204
-
205
-
206
-
207
-
208
-
209
-
210
-
211
-
212
-
213
-
214
-
215
-
216
-
217
-
218
-
219
-
220
-
221
-
222
-
223
-
224
-
225
-
226
-
227
-
228
-
229
-
230
-
231
-
232
-
233
-
234
-
235
-
236
-
237
-
238
-
239
-
240
-
241
-
242
-
243
-
244
-
245
-
246
-
247
-
248
-
249
-
250
-
251
-
252
-
253
-
254
-
255
-
256
-
257
-
258
-
259
-
260
-
261
-
262
-
263
-
264
-
265
-
266
-
267
-
268
-
269
-
270
-
271
-
272
-
273
-
274
-
275
-
276
-
277
-
278
-
279
-
280
-
281
-
282
-
283
-
284
-
285
-
286
-
287
-
288
-
289
-
290
-
291
-
292
-
293
-
294
-
295
-
296
-
297
-
298
-
299
-
300
-
301
-
302
-
303
-
304
-
305
-
306
-
307
-
308
-
309
-
310
-
311
-
312
-
313
-
314
-
315
-
316
-
317
-
318
-
319
-
320
-
321
-
322
-
323
-
324
-
325
-
326
-
327
-
328
-
329
-
330
-
331
-
332
-
333
-
334
-
335
-
336
-
337
-
338
-
339
-
340
-
341
-
342
-
343
-
344
-
345
-
346
-
347
-
348
-
349
-
350
-
351
-
352
-
353
-
354
-
355
-
356
-
357
-
358
-
359
-
360
-
361
-
362
-
363
-
364
-
365
-
366
-
367
-
368
-
369
-
370
-
371
-
372
-
373
-
374
-
375
-
376
-
377
-
378
-
379
-
380
-
381
-
382
-
383
-
384
-
385
-
386
-
387
-
388
-
389
-
390
-
391
-
392
-
393
-
394
-
395
-
396
-
397
-
398
-
399
 |
 |

5
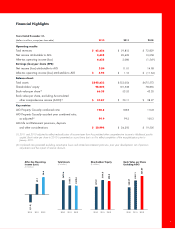
Years Ended December 31,
(dollars in millions, except per share data) 2012 2011 2010
Operating results:
Total revenues $ 65,656 $ 59,812 $ 72,829
Net income attributable to AIG 3,438 20,622 10,058
After-tax operating income (loss) 6,635 2,086 (1,549 )
Earnings (loss) per share (EPS):
Net income (loss) attributable to AIG 2.04 11.01 14.98
After-tax operating income (loss) attributable to AIG $ 3.93 $ 1.16 $ (11.34 )
Balance sheet:
Total assets $ 548,633 $ 553,054 $ 675,573
Shareholders' equity 98,002 101,538 78,856
Book value per share(1) 66.38 53.53 43.20
Book value per share, excluding Accumulated
other comprehensive income (AOCI)(1) $ 57.87 $ 50.11 $ 38.27
Key metrics:
AIG Property Casualty combined ratio 108.6 108.8 116.8
AIG Property Casualty accident year combined ratio,
as adjusted(2) 99.9 99.2 100.3
AIG Life and Retirement premiums, deposits
and other considerations $ 20,994 $ 24,392 $ 19,505
(1) 2011 and 2010 adjusted to reflect reclassification of income taxes from Accumulated other comprehensive income to Additional paid-in
capital. Book value per share in 2010 is presented on a pro forma basis as if to reflect completion of the recapitalization prior to
January 2011.
(2) Combined ratio presented excluding catastrophe losses and related reinstatement premiums, prior year development, net of premium
adjustments and the impact of reserve discount.
Financial Highlights
2010
Book Value per Share
Excluding AOCI
$38.27
$50.11
$57.87
2011 2012
2010
After-Tax Operating
Income (Loss)
($ in billions)
$(1.5)
$2.1
$6.6
2011 2012 2010
Total Assets
($ in billions)
$675.6
$553.1
$548.6
2011 2012 2010
Shareholders' Equity
($ in billions)
$78.9
$101.5
$98.0
2011 2012