ADP 2006 Annual Report Download - page 2
Download and view the complete annual report
Please find page 2 of the 2006 ADP annual report below. You can navigate through the pages in the report by either clicking on the pages listed below, or by using the keyword search tool below to find specific information within the annual report.-
 1
1 -
 2
2 -
 3
3 -
 4
4 -
 5
5 -
 6
6 -
 7
7 -
 8
8 -
 9
9 -
 10
10 -
 11
11 -
 12
12 -
 13
13 -
14
-
15
-
16
-
17
-
18
-
19
-
20
-
21
-
22
-
23
-
24
-
25
-
26
-
27
-
28
-
29
-
30
 |
 |

Contents
Financial Highlights
Financial Highlights > Inside Front Cover
Introduction > 1
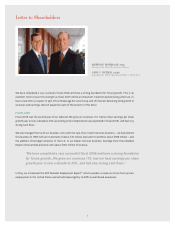
Letter to Shareholders > 2
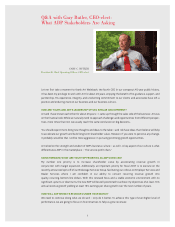
Q&A with Gary Butler, CEO-elect > 5
Business Narrative > 9
ADP At A Glance > 20
Selected Financial Data > 22
Directors & Corporate Officers > 26
Corporate Information > Inside Back Cover
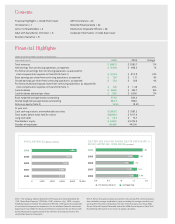
(Dollars and shares in millions, except per share amounts)
Years ended June 30, 2006 2005 Change
Total revenues $ 8,881.5 $ 7,983.7 11%
Net earnings from continuing operations, as reported $1,072.4 $ 998.3 7%
Pro forma net earnings from continuing operations, as adjusted for
stock compensation expense in fiscal 2005 (Note 1) $1,072.4 $ 873.8 23%
Basic earnings per share from continuing operations, as reported $ 1.87 $ 1.71 9%
Diluted earnings per share from continuing operations, as reported $ 1.85 $ 1.69 9%
Pro forma diluted earnings per share from continuing operations, as adjusted for
stock compensation expense in fiscal 2005 (Note 1) $ 1.85 $ 1.48 25%
Cash dividends $ 408.6 $ 352.7 16%
Cash dividends declared per share $ .7100 $ .6050 17%
Basic weighted average shares outstanding 574.8 583.2
Diluted weighted average shares outstanding 580.3 590.0
Return on equity (Note 2) 19.5% 18.3%
At year end:
Cash, cash equivalents, and marketable securities $ 2,602.5 $ 1,997.3
Total assets before funds held for clients $10,006.2 $ 9,717.9
Long-term debt $ 74.3 $ 75.7
Stockholders’ equity $ 6,011.6 $ 5,783.9
Number of employees 46,000 44,000
0 2,000 4,000 6,000 8,000 10,000
TOTAL REVENUES (Dollars in millions)
2006
6,571
2005
6,693
2004 7,279
2003
7,984
2002
8,882
0.0 0.5 1.0 1.5 2.0
DILUTED EPS AND PRO FORMA DILUTED EPS (NOTE 1)
FROM CONTINUING OPERATIONS
(In dollars)
2006
1.85
2005
1.69
2004
1.50
2003
1.63
2002
1.50
1.48
1.32
1.44
1.68
•Pro forma (Note 1) •As Reported
Note 1. The Company adopted Statement of Financial Accounting Standards No.
123R, “Share-Based Payment” (“SFAS No. 123R”), effective July 1, 2005, using the
modified prospective method. The adoption of SFAS No. 123R requires the recognition
of stock-based compensation expense in the consolidated financial statements
beginning in fiscal 2006. The financial information stated includes pro forma stock-
based compensation expense based on the amounts disclosed previously in the
consolidated financial statements.
Note 2. Return on equity has been calculated as net earnings from continuing opera-
tions divided by average stockholders’ equity, excluding the average cumulative net
earnings from discontinued operations for each of the five years since fiscal 2002.
See our Selected Financial Data table within the 2006 Annual Report on Form 10-K
for additional information on our return on equity calculation.