3M 2012 Annual Report Download - page 41
Download and view the complete annual report
Please find page 41 of the 2012 3M annual report below. You can navigate through the pages in the report by either clicking on the pages listed below, or by using the keyword search tool below to find specific information within the annual report.-
 1
1 -
2
-
3
-
4
-
5
-
6
-
7
-
8
-
9
-
10
-
11
-
12
-
13
-
14
-
15
-
16
-
17
-
18
-
19
-
20
-
21
-
22
-
23
-
24
-
25
-
26
-
27
-
28
-
29
-
30
-
 31
31 -
 32
32 -
 33
33 -
 34
34 -
 35
35 -
 36
36 -
 37
37 -
 38
38 -
 39
39 -
 40
40 -
 41
41 -
 42
42 -
 43
43 -
 44
44 -
 45
45 -
 46
46 -
 47
47 -
 48
48 -
 49
49 -
 50
50 -
 51
51 -
52
-
53
-
54
-
55
-
56
-
57
-
58
-
59
-
60
-
61
-
62
-
63
-
64
-
65
-
66
-
67
-
68
-
69
-
70
-
71
-
72
-
73
-
74
-
75
-
76
-
77
-
78
-
79
-
80
-
81
-
82
-
83
-
84
-
85
-
86
-
87
-
88
-
89
-
90
-
91
-
92
-
93
-
94
-
95
-
96
-
97
-
98
-
99
-
100
-
101
-
102
-
103
-
104
-
105
-
106
-
107
-
108
-
109
-
110
-
111
-
112
-
113
-
114
-
115
-
116
-
117
-
118
-
119
-
120
-
121
-
122
-
123
-
124
-
125
-
126
-
127
-
128
-
129
-
130
-
131
-
132
 |
 |
35
dividend on 3M common stock by 7.6 percent to 63.5 cents per share, equivalent to an annual dividend of $2.54 per
share. In February 2013, 3M’s Board of Directors also authorized the repurchase of up to $7.5 billion of 3M’s outstanding
common stock, replacing the Company’s existing repurchase program. This authorization has no pre-established end
date.
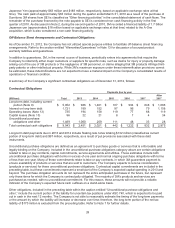
In 2013, the Company plans to contribute an amount in the range of $400 million to $600 million of cash to its U.S. and
international pension and postretirement plans. The Company does not have a required minimum cash pension
contribution obligation for its U.S. plans in 2013. Therefore, the amount of the anticipated discretionary contribution could
vary significantly depending on the U.S. qualified plans’ funded status as of the 2013 measurement date and the
anticipated tax deductibility of the contribution. Future contributions will also depend on market conditions, interest rates
and other factors. 3M believes its strong cash flow and balance sheet will allow it to fund future pension needs without
compromising growth opportunities.
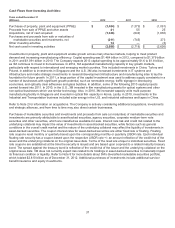
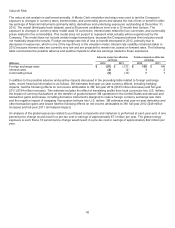
The Company uses various working capital measures that place emphasis and focus on certain working capital assets
and liabilities. These measures are not defined under U.S. generally accepted accounting principles and may not be
computed the same as similarly titled measures used by other companies. One of the primary working capital measures
3M uses is a combined index, which includes accounts receivable, inventories and accounts payable. This combined
index (defined as quarterly net sales — fourth quarter at year-end — multiplied by four, divided by ending net accounts
receivable plus inventories less accounts payable) was 4.8 at December 31, 2012, a decline from 5.0 at December 31,
2011. Receivables increased $194 million, or 5.0 percent, compared with December 31, 2011, driven by a year-on-year
increase in fourth quarter sales. Acquisitions increased accounts receivable by $84 million and currency translation
decreased accounts receivable by $23 million. Inventories increased $421 million, or 12.3 percent, compared with
December 31, 2011, with the increases partially attributable to an increase in demand in the fourth-quarter of 2012 when
compared to the fourth quarter of 2011. Acquisitions increased inventories by $125 million, while currency translation
increased inventories by $46 million. Accounts payable increased $119 million compared with December 31, 2011.
Acquisitions increased the accounts payable balance by $26 million, while currency translation increased accounts
payable by $13 million.
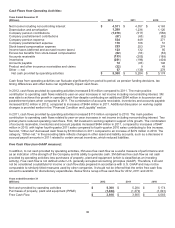
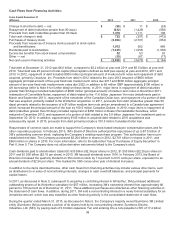
Cash flows from operating, investing and financing activities are provided in the tables that follow. Individual amounts in
the Consolidated Statement of Cash Flows exclude the effects of acquisitions, divestitures and exchange rate impacts on
cash and cash equivalents, which are presented separately in the cash flows. Thus, the amounts presented in the
following operating, investing and financing activities tables reflect changes in balances from period to period adjusted for
these effects.