3M 2012 Annual Report Download - page 19
Download and view the complete annual report
Please find page 19 of the 2012 3M annual report below. You can navigate through the pages in the report by either clicking on the pages listed below, or by using the keyword search tool below to find specific information within the annual report.-
 1
1 -
2
-
3
-
4
-
5
-
6
-
7
-
8
-
 9
9 -
 10
10 -
 11
11 -
 12
12 -
 13
13 -
 14
14 -
 15
15 -
 16
16 -
 17
17 -
 18
18 -
 19
19 -
 20
20 -
 21
21 -
 22
22 -
 23
23 -
 24
24 -
 25
25 -
 26
26 -
 27
27 -
 28
28 -
 29
29 -
30
-
31
-
32
-
33
-
34
-
35
-
36
-
37
-
38
-
39
-
40
-
41
-
42
-
43
-
44
-
45
-
46
-
47
-
48
-
49
-
50
-
51
-
52
-
53
-
54
-
55
-
56
-
57
-
58
-
59
-
60
-
61
-
62
-
63
-
64
-
65
-
66
-
67
-
68
-
69
-
70
-
71
-
72
-
73
-
74
-
75
-
76
-
77
-
78
-
79
-
80
-
81
-
82
-
83
-
84
-
85
-
86
-
87
-
88
-
89
-
90
-
91
-
92
-
93
-
94
-
95
-
96
-
97
-
98
-
99
-
100
-
101
-
102
-
103
-
104
-
105
-
106
-
107
-
108
-
109
-
110
-
111
-
112
-
113
-
114
-
115
-
116
-
117
-
118
-
119
-
120
-
121
-
122
-
123
-
124
-
125
-
126
-
127
-
128
-
129
-
130
-
131
-
132
 |
 |

13
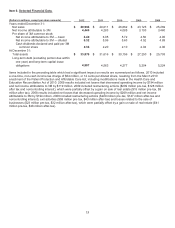
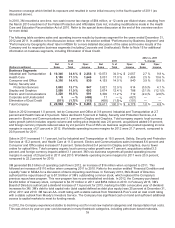
Item 6. Selected Financial Data.
(Dollars in millions, except per share amounts)
2012
2011
2010
2009
2008
Years ended December 31:
Net sales
$
29,904
$
29,611
$
26,662
$
23,123
$
25,269
Net income attributable to 3M
4,444
4,283
4,085
3,193
3,460
Per share of 3M common stock:
Net income attributable to 3M — basic
6.40
6.05
5.72
4.56
4.95
Net income attributable to 3M — diluted
6.32
5.96
5.63
4.52
4.89
Cash dividends declared and paid per 3M
common share
2.36
2.20
2.10
2.04
2.00
At December 31:
Total assets
$
33,876
$ 31,616
$ 30,156
$ 27,250
$ 25,793
Long-term debt (excluding portion due within
one year) and long-term capital lease
obligations
4,987
4,563
4,277
5,204
5,224
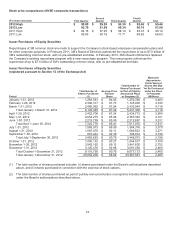
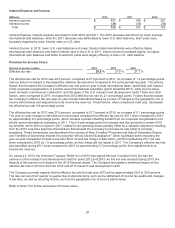
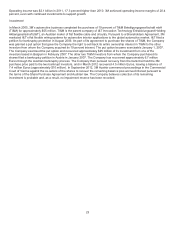
Items included in the preceding table which had a significant impact on results are summarized as follows. 2010 included
a one-time, non-cash income tax charge of $84 million, or 12 cents per diluted share, resulting from the March 2010
enactment of the Patient Protection and Affordable Care Act, including modifications made in the Health Care and
Education Reconciliation Act of 2010. 2009 results included net losses that decreased operating income by $194 million
and net income attributable to 3M by $119 million. 2009 included restructuring actions ($209 million pre-tax, $128 million
after tax and noncontrolling interest), which were partially offset by a gain on sale of real estate ($15 million pre-tax, $9
million after tax). 2008 results included net losses that decreased operating income by $269 million and net income
attributable to 3M by $194 million. 2008 included restructuring actions ($229 million pre-tax, $147 million after-tax and
noncontrolling interest), exit activities ($58 million pre-tax, $43 million after-tax) and losses related to the sale of
businesses ($23 million pre-tax, $32 million after-tax), which were partially offset by a gain on sale of real estate ($41
million pre-tax, $28 million after-tax).