3M 2004 Annual Report Download - page 79
Download and view the complete annual report
Please find page 79 of the 2004 3M annual report below. You can navigate through the pages in the report by either clicking on the pages listed below, or by using the keyword search tool below to find specific information within the annual report.-
 1
1 -
2
-
3
-
4
-
5
-
6
-
7
-
8
-
9
-
10
-
11
-
12
-
13
-
14
-
15
-
16
-
17
-
18
-
19
-
20
-
21
-
22
-
23
-
24
-
25
-
26
-
27
-
28
-
29
-
30
-
31
-
32
-
33
-
34
-
35
-
36
-
37
-
38
-
39
-
40
-
41
-
42
-
43
-
44
-
45
-
46
-
47
-
48
-
49
-
50
-
51
-
52
-
53
-
54
-
55
-
56
-
57
-
58
-
59
-
60
-
61
-
62
-
63
-
64
-
65
-
66
-
67
-
68
-
 69
69 -
 70
70 -
 71
71 -
 72
72 -
 73
73 -
 74
74 -
 75
75 -
 76
76 -
 77
77 -
 78
78 -
 79
79 -
 80
80 -
 81
81 -
 82
82 -
 83
83 -
 84
84 -
 85
85 -
 86
86 -
 87
87 -
 88
88 -
 89
89 -
90
-
91
-
92
-
93
-
94
-
95
-
96
-
97
-
98
-
99
-
100
-
101
-
102
-
103
-
104
-
105
-
106
 |
 |

53
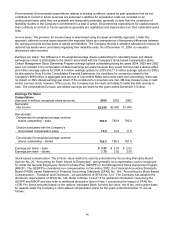
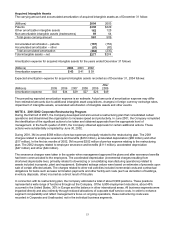
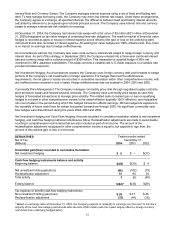
Acquired Intangible Assets
The carrying amount and accumulated amortization of acquired intangible assets as of December 31 follow:
(Millions) 2004 2003
Patents $330 $320
Other amortizable intangible assets 162 125
Non-amortizable intangible assets (tradenames) 69 64
Total gross carrying amount 561 509
Accumulated amortization – patents (187) (153)
Accumulated amortization – other (97) (82)
Total accumulated amortization (284) (235)
Total intangible assets – net $277 $274
Amortization expense for acquired intangible assets for the years ended December 31 follows:
(Millions) 2004 2003 2002
Amortization expense $ 43 $ 41 $ 39
Expected amortization expense for acquired intangible assets recorded as of December 31, 2004 follows:
After
(Millions) 2005 2006 2007 2008 2009 2009
Amortization expense $43 $34 $29 $27 $26 $49
The preceding expected amortization expense is an estimate. Actual amounts of amortization expense may differ
from estimated amounts due to additional intangible asset acquisitions, changes in foreign currency exchange rates,
impairment of intangible assets, accelerated amortization of intangible assets and other events.
NOTE 4. 2001/2002 Corporate Restructuring Program
During the first half of 2001, the Company developed and announced a restructuring plan that consolidated certain
operations and streamlined the organization to increase speed and productivity. In June 2001, the Company completed
the identification of the significant actions to be taken and obtained approvals from the appropriate level of
management. In the fourth quarter of 2001, the Company obtained approvals for certain additional actions. These
actions were substantially completed by June 30, 2002.
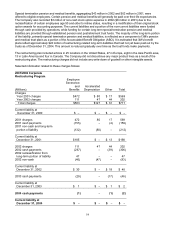
During 2001, 3M incurred $569 million of pre-tax expenses principally related to the restructuring plan. The 2001
charges related to employee severance and benefits ($472 million), accelerated depreciation ($80 million) and other
($17 million). In the first six months of 2002, 3M incurred $202 million of pre-tax expense relating to the restructuring
plan. The 2002 charges related to employee severance and benefits ($111 million), accelerated depreciation
($47 million) and other ($44 million).
The severance charges were taken in the quarter when management approved the plans and after severance benefits
had been communicated to the employees. The accelerated depreciation (incremental charges resulting from
shortened depreciable lives, primarily related to downsizing or consolidating manufacturing operations) related to
assets included in property, plant and equipment. Estimated salvage values were based on estimates of proceeds upon
sale of certain affected assets. The charges related to other exit activities included incremental costs and contractual
obligations for items such as lease termination payments and other facility exit costs (such as demolition of buildings,
inventory disposals, other) incurred as a direct result of this plan.
In connection with its restructuring plan, the Company eliminated a total of about 6,900 positions. These positions
represented a wide range of functions throughout the Company. Of the 6,900 employment reductions, about 45%
occurred in the United States, 30% in Europe and the balance in other international areas. All business segments were
impacted directly and also indirectly through reduced allocations of corporate staff service costs. In order to enhance
segment comparability and reflect management’s focus on ongoing operations, these restructuring costs were
recorded in Corporate and Unallocated, not in the individual business segments.