3M 2004 Annual Report Download - page 53
Download and view the complete annual report
Please find page 53 of the 2004 3M annual report below. You can navigate through the pages in the report by either clicking on the pages listed below, or by using the keyword search tool below to find specific information within the annual report.-
 1
1 -
2
-
3
-
4
-
5
-
6
-
7
-
8
-
9
-
10
-
11
-
12
-
13
-
14
-
15
-
16
-
17
-
18
-
19
-
20
-
21
-
22
-
23
-
24
-
25
-
26
-
27
-
28
-
29
-
30
-
31
-
32
-
33
-
34
-
35
-
36
-
37
-
38
-
39
-
40
-
41
-
42
-
 43
43 -
 44
44 -
 45
45 -
 46
46 -
 47
47 -
 48
48 -
 49
49 -
 50
50 -
 51
51 -
 52
52 -
 53
53 -
 54
54 -
 55
55 -
 56
56 -
 57
57 -
 58
58 -
 59
59 -
 60
60 -
 61
61 -
 62
62 -
 63
63 -
64
-
65
-
66
-
67
-
68
-
69
-
70
-
71
-
72
-
73
-
74
-
75
-
76
-
77
-
78
-
79
-
80
-
81
-
82
-
83
-
84
-
85
-
86
-
87
-
88
-
89
-
90
-
91
-
92
-
93
-
94
-
95
-
96
-
97
-
98
-
99
-
100
-
101
-
102
-
103
-
104
-
105
-
106
 |
 |

27
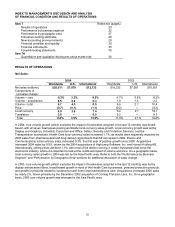
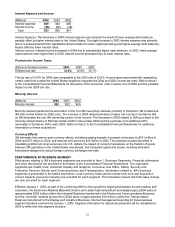
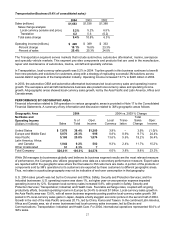
Transportation Business (8.4% of consolidated sales):
2004 2003 2002
Sales (millions) $1,683 $1,538 $1,388
Sales change analysis:
Local currency (volume and price) 5.2% 5.2% 6.5%
Translation 4.2 5.6 (0.2)
Total sales change 9.4% 10.8% 6.3%
Operating income (millions) $ 428 $ 389 $ 333
Percent change 10.1% 16.8% 23.3%
Percent of sales 25.4% 25.3% 24.0%
The Transportation segment serves markets that include automotive, automotive aftermarket, marine, aerospace
and specialty vehicle markets. This segment provides components and products that are used in the manufacture,
repair and maintenance of automotive, marine, aircraft and specialty vehicles.
In Transportation, local-currency sales growth was 5.2% in 2004. Top-line growth in this business continues to benefit
from new products and solutions for customers, along with a strategy of replicating successful 3M solutions across
several distinct segments of the transportation industry. Operating income increased 10.1% to $428 million in 2004.
In 2003, the automotive OEM and automotive aftermarket businesses led local-currency sales and operating income
growth. The aerospace and aircraft maintenance business also posted local-currency sales and operating income
growth. All geographic areas showed local-currency sales growth, led by the Asia Pacific and Latin America, Africa and
Canada areas.
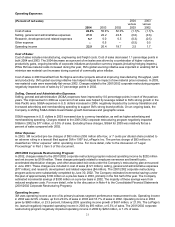
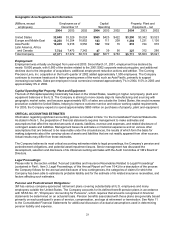
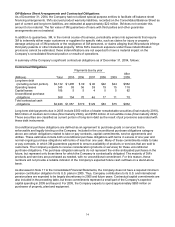
PERFORMANCE BY GEOGRAPHIC AREA
Financial information related to 3M operations in various geographic areas is provided in Note 17 to the Consolidated
Financial Statements. A summary of key information and discussion related to 3M’s geographic areas follows:
Geographic Area 2004 2004 vs. 2003 % Change
Net Sales and
Operating Income
(Dollars in millions) Sales
% of
Total
Oper.
Income
Local
Currency
Trans-
lation
Total
Sales
Change
Oper.
Income
United States $ 7,878 39.4% $1,200 3.9% – 3.9% (1.0)%
Europe and Middle East 5,070 25.3% 995 0.8% 8.9% 9.7% 24.4%
Asia Pacific 5,168 25.8% 1,874 13.6% 5.6% 19.2% 36.4%
Latin America, Africa
and Canada 1,844 9.2% 502 9.3% 2.4% 11.7% 15.2%
Other Unallocated 51 0.3% 7
Total Company $20,011 100.0% $4,578 6.0% 3.8% 9.8% 23.3%
While 3M manages its businesses globally and believes its business segment results are the most relevant measure
of performance, the Company also utilizes geographic area data as a secondary performance measure. Export sales
are reported within the geographic area where the final sales to 3M customers are made. A portion of the products or
components sold by 3M’s operations to its customers are exported by these customers to different geographic areas.
Thus, net sales in a particular geography may not be indicative of end-user consumption in that geography.
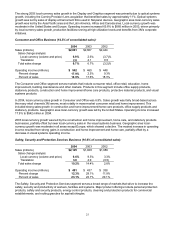
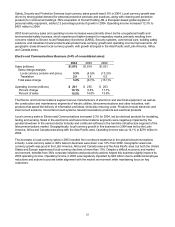
U.S. 2004 sales growth was led by the Consumer and Office; Safety, Security and Protection Services; and the
Industrial businesses. U.S. operating income was down 1%, as higher year-on-year pension expense impacted
operating income by 12%. European local-currency sales increased 0.8%, with growth in Safety, Security and
Protection Services; Transportation; Industrial; and Health Care. Favorable exchange rates, coupled with ongoing
productivity efforts, boosted operating income in Europe by 24.4% to almost $1 billion. Local-currency sales growth in
the Asia Pacific area was 13.6%, with all seven business segments posting positive local-currency sales growth. 3M
posted 4.3% local-currency sales gains in Japan, despite a fairly sluggish economic picture in the second half of 2004.
Growth in the rest of the Asia Pacific area was 20.7%, led by China, Korea and Taiwan. In the combined Latin America,
Africa and Canada area, six of seven businesses had local-currency sales increases, led by Electro and
Communications; Transportation; Industrial; and Health Care. For 2004, international operations represented 60.6% of
3M’s sales.