Yamaha 1998 Annual Report Download - page 9
Download and view the complete annual report
Please find page 9 of the 1998 Yamaha annual report below. You can navigate through the pages in the report by either clicking on the pages listed below, or by using the keyword search tool below to find specific information within the annual report.-
 1
1 -
 2
2 -
 3
3 -
 4
4 -
 5
5 -
 6
6 -
 7
7 -
 8
8 -
 9
9 -
 10
10 -
 11
11 -
 12
12 -
 13
13 -
 14
14 -
 15
15 -
 16
16 -
 17
17
 |
 |

YAMAHA CONSOLIDATED FINANCIAL REPORT 8
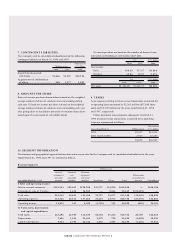
7. CONTINGENT LIABILITIES
The Company and its consolidated subsidiaries had the following
contingent liabilities at March 31, 1998 and 1997:
Thousands of
Millions of yen U.S. dollars
1998 1997 1998
Export bills discounted
with banks .............................. ¥1,866 ¥2,409 $14,126
As guarantors of indebtedness
of others.................................. 209 1,977 1,582
8. AMOUNTS PER SHARE
Basic net income per share shown below is based on the weighted
average number of shares of common stock outstanding during
each year. Diluted net income per share is based on the weighted
average number of shares of common stock outstanding each year
after giving effect to the dilutive potential of common shares to be
issued upon the conversion of convertible bonds.
Net assets per share are based on the number of shares of com-
mon stock outstanding at each balance sheet date.
Yen U.S. dollars
1998 1997 1998
Net income:
Basic................................... ¥65.25 ¥71.97 $0.494
Diluted............................... 62.86 65.83 0.476
Yen U.S. dollars
1998 1997 1998
Net assets........................ ¥1,123.09 ¥1,065.17 $8.502
9. LEASES
Lease expenses relating to finance lease transactions accounted for
as operating leases amounted to ¥2,363 million ($17,888 thou-
sand) and ¥2,709 million for the years ended March 31, 1998
and 1997, respectively.
Future minimum lease payments subsequent to March 31,
1998 for finance lease transactions accounted for as operating
leases are summarized as follows:
Thousands of
Year ending March 31, Millions of yen U.S. dollars
1999 ................................................... ¥1,917 $14,512
2000 and thereafter............................. 2,960 22,407
........................................................... ¥4,878 $36,927
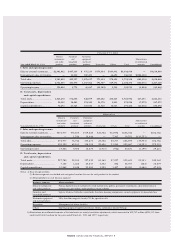
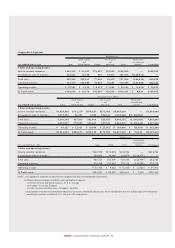
10. SEGMENT INFORMATION
The business and geographical segment information and overseas sales for the Company and its consolidated subsidiaries for the years
ended March 31, 1998 and 1997 are outlined as follows:
Business Segments
Millions of yen
Musical Furniture Electronic
instruments and equipment
Eliminations
and audio household and metal or unallocated
Year ended March 31, 1998 products products products
Recreation Others Total amounts Consolidated
I. Sales and operating income
Sales to external customers.......... ¥383,365 ¥59,067 ¥128,298 ¥23,727 ¥14,530 ¥608,990 — ¥608,990
Intersegment sales or transfers..... — 1,613 14,189 — 8,546 24,349 ¥(24,349) —
Total sales................................... 383,365 60,681 142,488 23,727 23,077 633,340 (24,349) 608,990
Operating expenses..................... 363,546 60,314 137,062 25,483 22,374 608,780 (23,893) 584,886
Operating income....................... 19,819 367 5,425 (1,755) 702 24,559 (455) 24,103
II. Total assets, depreciation
and capital expenditures
Total assets................................. 243,496 22,993 111,635 80,354 57,234 515,716 28,749 544,465
Depreciation............................... 7,696 1,914 23,036 3,075 729 36,454 (1,054) 35,399
Capital expenditures................... 9,312 2,793 22,442 1,963 1,983 38,495 (1,428) 37,066